Predictive Maintenance From Sensor Data: A Measured Example
Predictive maintenance uses machine readings to flag which equipment is likely to fail, so inspections go where they matter. A measured example on 2,000 held-back readings, with the leaks it caught.
In this article
Predictive maintenance means using readings from equipment — temperatures, speeds, torque, wear, operating hours — to estimate which machines are likely to fail soon, so that inspections and repairs go to them first instead of following a fixed calendar or waiting for a breakdown.
Most predictive maintenance starts with a simple question a model can answer: given this machine's latest readings, how likely is a failure? Rank every machine or reading by that likelihood, inspect from the top, and stop where an inspection stops paying for itself.
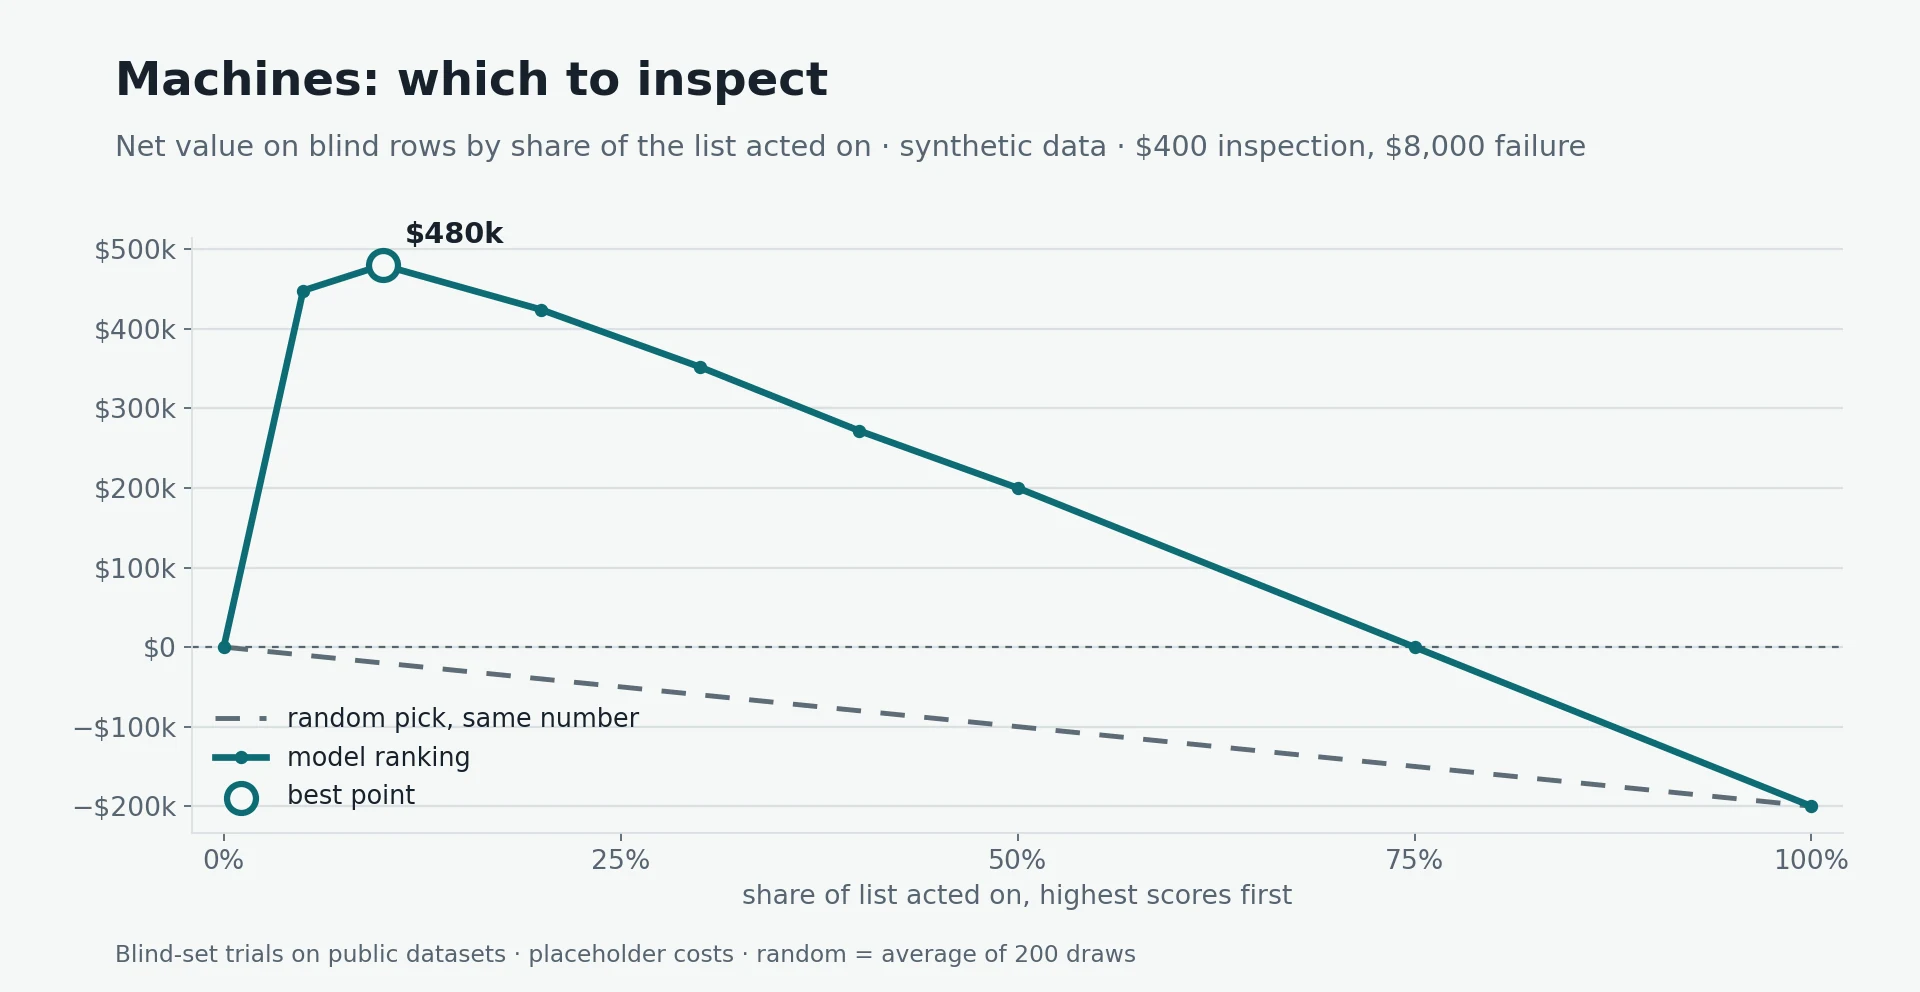
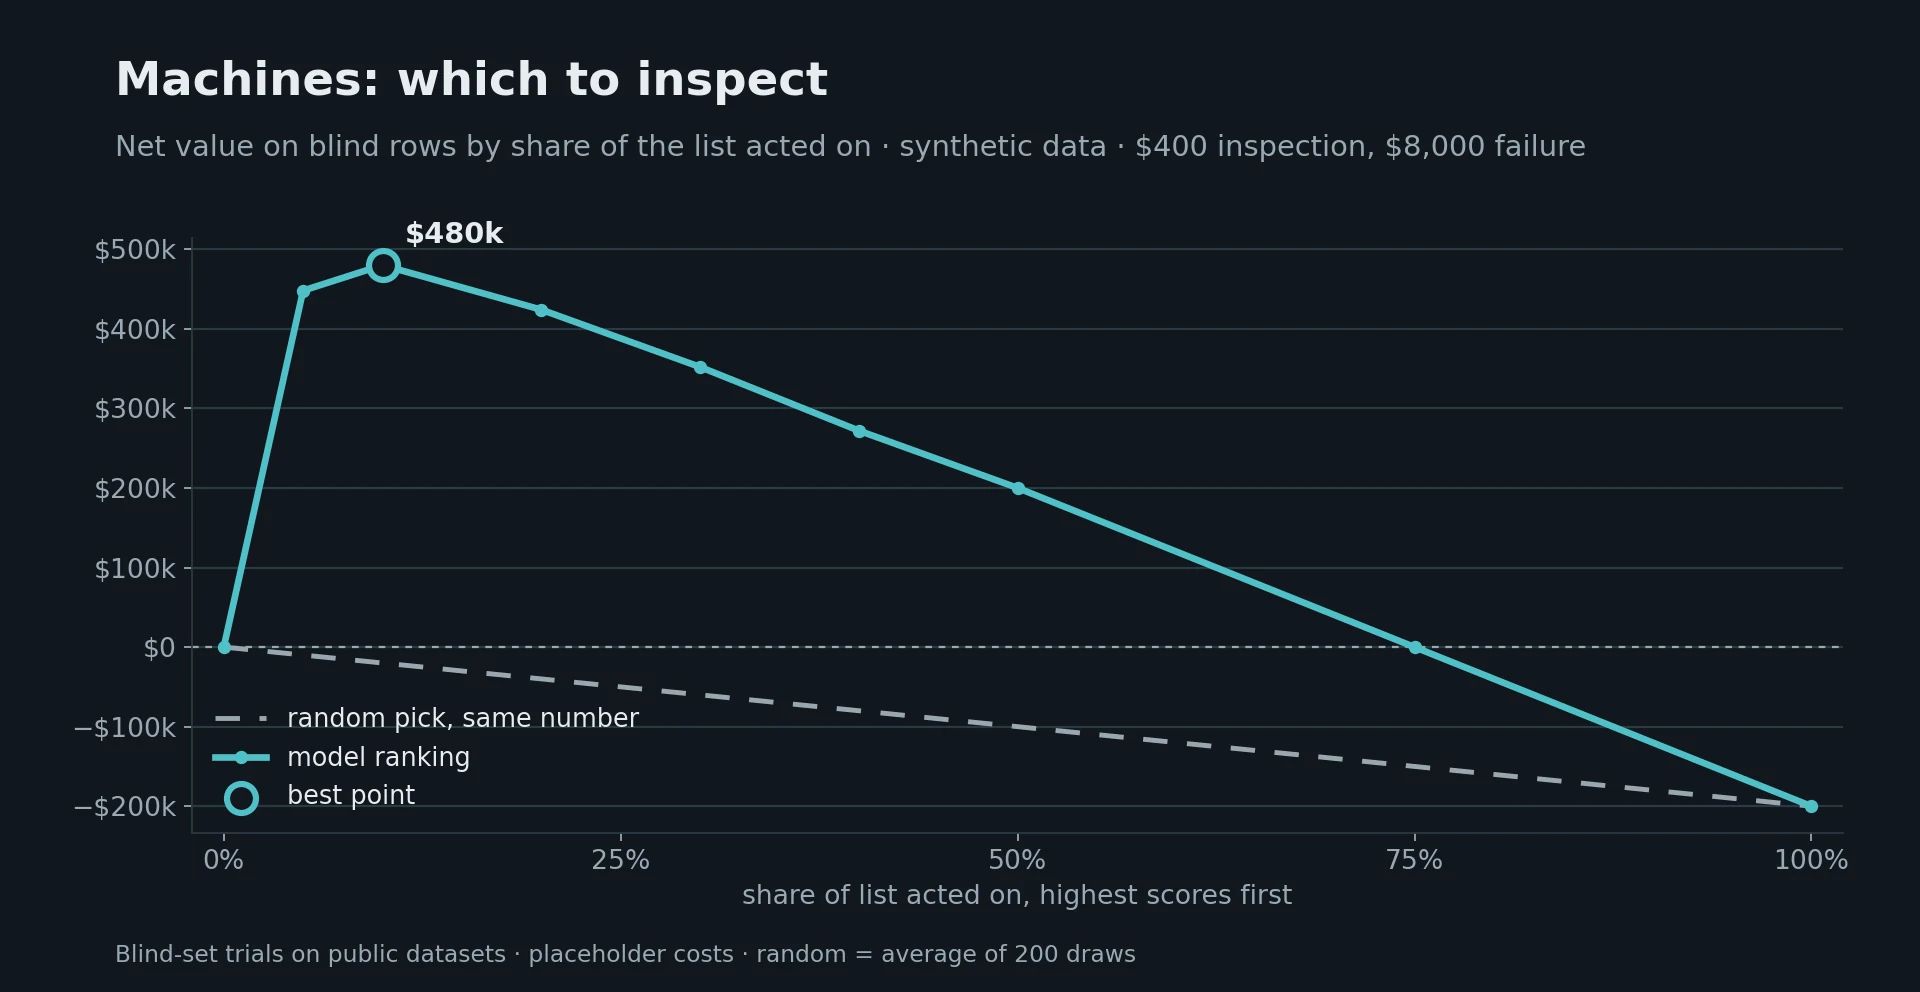
Measured example: on 2,000 sensor readings held back from training in the public AI4I 2020 dataset, the 10% the model flagged as riskiest contained 70 of the 75 failures (93%). Inspecting that 10% was worth about $480,000 under the placeholder costs below; inspecting everything would have lost $200,000. The data is synthetic and generated by fixed rules, so results on real equipment will be lower.
What your data needs
- One row per machine reading (or per machine per day), with one column saying whether a failure followed within the window you care about.
- Readings that exist before the failure: sensor values, settings, product or machine type, hours since the last service.
- Enough failures to learn from. Failures are usually rare — 3.4% of readings in this example — so you need thousands of readings to have dozens of failures.
Leave out anything recorded because of a failure. Maintenance systems often log which kind of failure happened in separate columns. Each one looks weak on its own, but together they are the failure, and a model trained on them looks perfect in testing and useless in operation. This is target leakage spread across a group of columns, and it appeared in this dataset.
A measured example: 10,000 machine readings
What we measured
- Data: AI4I 2020 Predictive Maintenance Dataset — 10,000 synthetic readings of air and process temperature, rotational speed, torque and tool wear, with product type; 3.4% of readings are followed by a failure.
- Test design: 2,000 readings (20%) were held back before any model was trained; every result below comes from them.
- Model: YourCloudGroup Model Manager ran its twelve-variant tournament; XGBoost won, with a ranking quality (AUC) of 0.98.
- Placeholder costs: an inspection costs $400 and prevents the failure; an unprevented failure costs $8,000.
The leaks the screening caught
- Four failure-mode flags (tool wear, heat dissipation, power and overstrain failure) were flagged together as a leakage risk and kept out — each was too weak to trigger a single-column check, but as a group they rebuild the outcome.
- The row number (UDI) was flagged as an identifier and kept out.
- A fifth flag for random failures barely tracks the outcome (18 of its 19 flagged rows are not failures), so the screening did not treat it as a leak; the operator excluded it anyway, with a recorded reason.
How much each inspection strategy earned
| Readings inspected | Ranked by the model | Picked at random |
|---|---|---|
| Top 5% | $448,000 | −$10,000 |
| Top 10% | $480,000 | −$20,000 |
| Top 20% | $424,000 | −$40,000 |
| Top 30% | $352,000 | −$60,000 |
| Top 50% | $200,000 | −$100,000 |
| Top 75% | $0 | −$150,000 |
| Everything | −$200,000 | −$200,000 |
What the result means
The model's ranking put almost every failure at the very top of the list, so a small number of inspections caught most of them. Beyond about the top 10%, each extra inspection mostly checks healthy machines and costs more than it saves. Inspecting at random never pays here, because failures are too rare to find by chance.
What the result does not show
This is the most important caveat on this page: the AI4I data is synthetic. Its failures follow fixed rules applied to the sensor readings, so a model can learn those rules almost perfectly. Real machines fail for messier reasons, sensors drift, and failure records are incomplete; expect a real ranking to be useful but noticeably less sharp. The $480,000 is also a product of the placeholder costs. And the test predicts whether a failure follows a reading — it does not estimate how long until failure (remaining useful life), which needs time-series modelling that these trials did not cover.
How to start predictive maintenance
- Pick one asset type with a clear inspection cost and failure cost.
- Export readings with a failure label — "failed within the next N days: yes/no" — from your maintenance and monitoring systems.
- Remove failure-type codes, repair notes and anything else written after the event, and drop machine or row identifiers.
- Test on readings held back from training — ideally the most recent ones, since conditions change (held-out evaluation).
- Choose the cut-off with your own costs, and run the ranked inspection list alongside your current schedule for one cycle.
- Re-check every quarter against new failures.
How YourCloudGroup Model Manager does it
YourCloudGroup Model Manager builds the model from a CSV export in a browser, on a dedicated server. It seals a held-back test set, screens columns — including groups of columns — for leakage, compares twelve model variants on the same test, and issues a certificate of what was proven. Trained models can score new readings on a schedule (hourly, daily, weekly or monthly). See the full business trials for the other two cases.
Takeaway
Predictive maintenance pays when failures are costly, inspections are not free, and the data records failures honestly. The value comes from ranking — inspecting the riskiest few first — and from making sure no column quietly records the failure itself.
Sources
- Matzka, S. (2020). Explainable Artificial Intelligence for Predictive Maintenance Applications. AI4I 2020 Predictive Maintenance Dataset, UCI Machine Learning Repository, CC BY 4.0.
- YourCloudGroup blind-set trials, 30 September 2026: Predictions from business spreadsheets.
Build predictive models from your own data
YourCloudGroup Model Manager builds, evaluates, certifies and schedules predictive models from your CSV or spreadsheet data — point and click, on your own dedicated server.
Learn about Model Manager →Published by YourCloudGroup. Read our editorial standards and corrections policy.


