Predictive Analytics for Small Business: What It Is, What It Costs and How to Start
Predictive analytics uses your past records to rank what to act on next — which customers to keep, which leads to call, which machines to inspect. Measured examples, real costs and a six-step start.
In this article
Predictive analytics is the use of a business's own historical records to estimate what is likely to happen next — which customers will leave, which prospects will buy, which machines will fail — so that effort goes where it pays. The estimate comes from a predictive model: software that learns which patterns in past cases came before each outcome, and is then tested on cases it has never seen.
For a small business, the practical value is almost always ranking. You rarely need to know the future exactly; you need to know who or what to act on first when you cannot act on everyone.
Predictive analytics, predictive modeling and predictive AI
The three terms describe the same family of work and are often used interchangeably:
- Predictive analytics is the business practice: using data to anticipate outcomes and decide what to do.
- Predictive modeling is the technical step: building and testing the model that produces the estimates. Most models answer either "which category?" (classification — will this customer leave?) or "how much?" (regression — what will this order be worth?).
- Predictive AI is the newer name for the same thing, used to distinguish it from generative AI such as chatbots. A predictive model produces a category or a number for a row of data, and its accuracy can be measured; a chatbot produces text.
What predictive analytics looks like on real data
These are measured results from blind tests on three public datasets, run end to end on YourCloudGroup Model Manager. Every figure comes from records the model never saw during training, and dollar values use stated placeholder costs.
| Business question | Data | Ranking quality (AUC) | Result on held-back records |
|---|---|---|---|
| Which customers will leave? | IBM Telco sample, 7,043 customers, 26.5% churned | 0.83 | Offers to the top-ranked half: about $42,000 net, against $11,000 for offering everyone |
| Which prospects to call first? | UCI Bank Marketing, 41,188 calls | 0.72 | With capacity for 20% of the list: 1.9× the profit of calling at random ($83,000 against $43,000) |
| Which machines to inspect? | AI4I 2020, 10,000 sensor readings (synthetic) | 0.98 | Inspecting the top 10% flagged: about $480,000 saved; inspecting everything: −$200,000 |
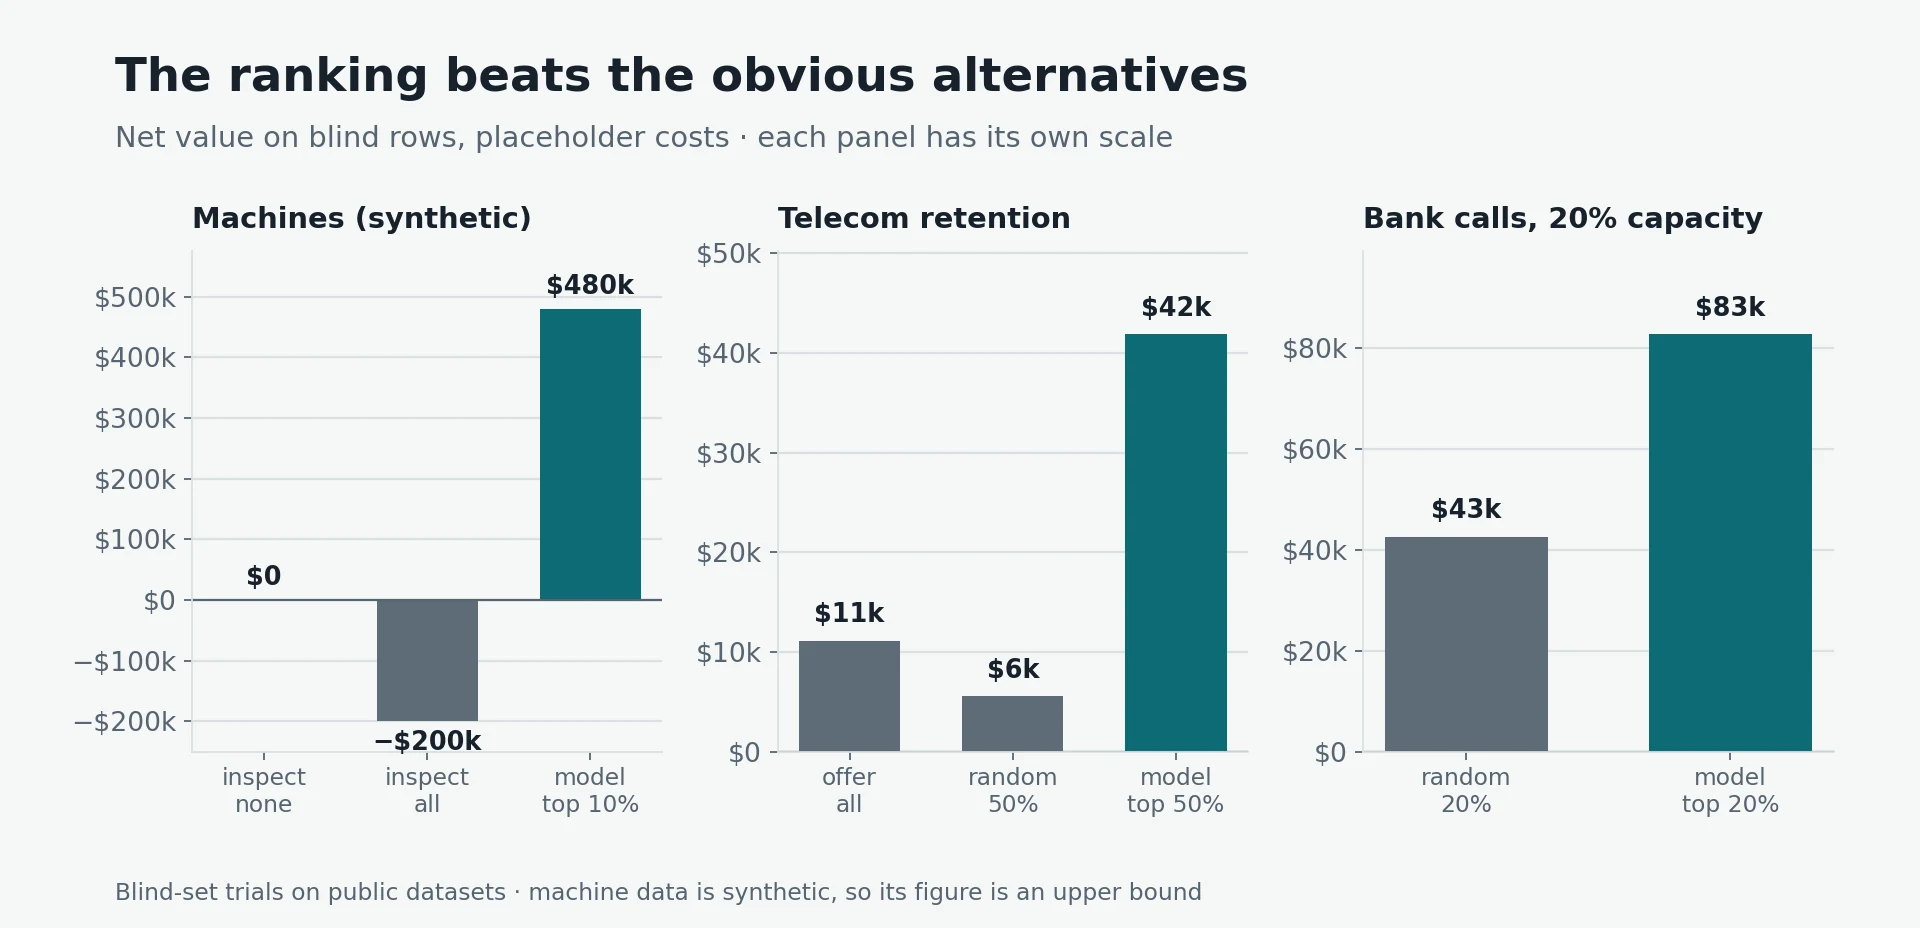
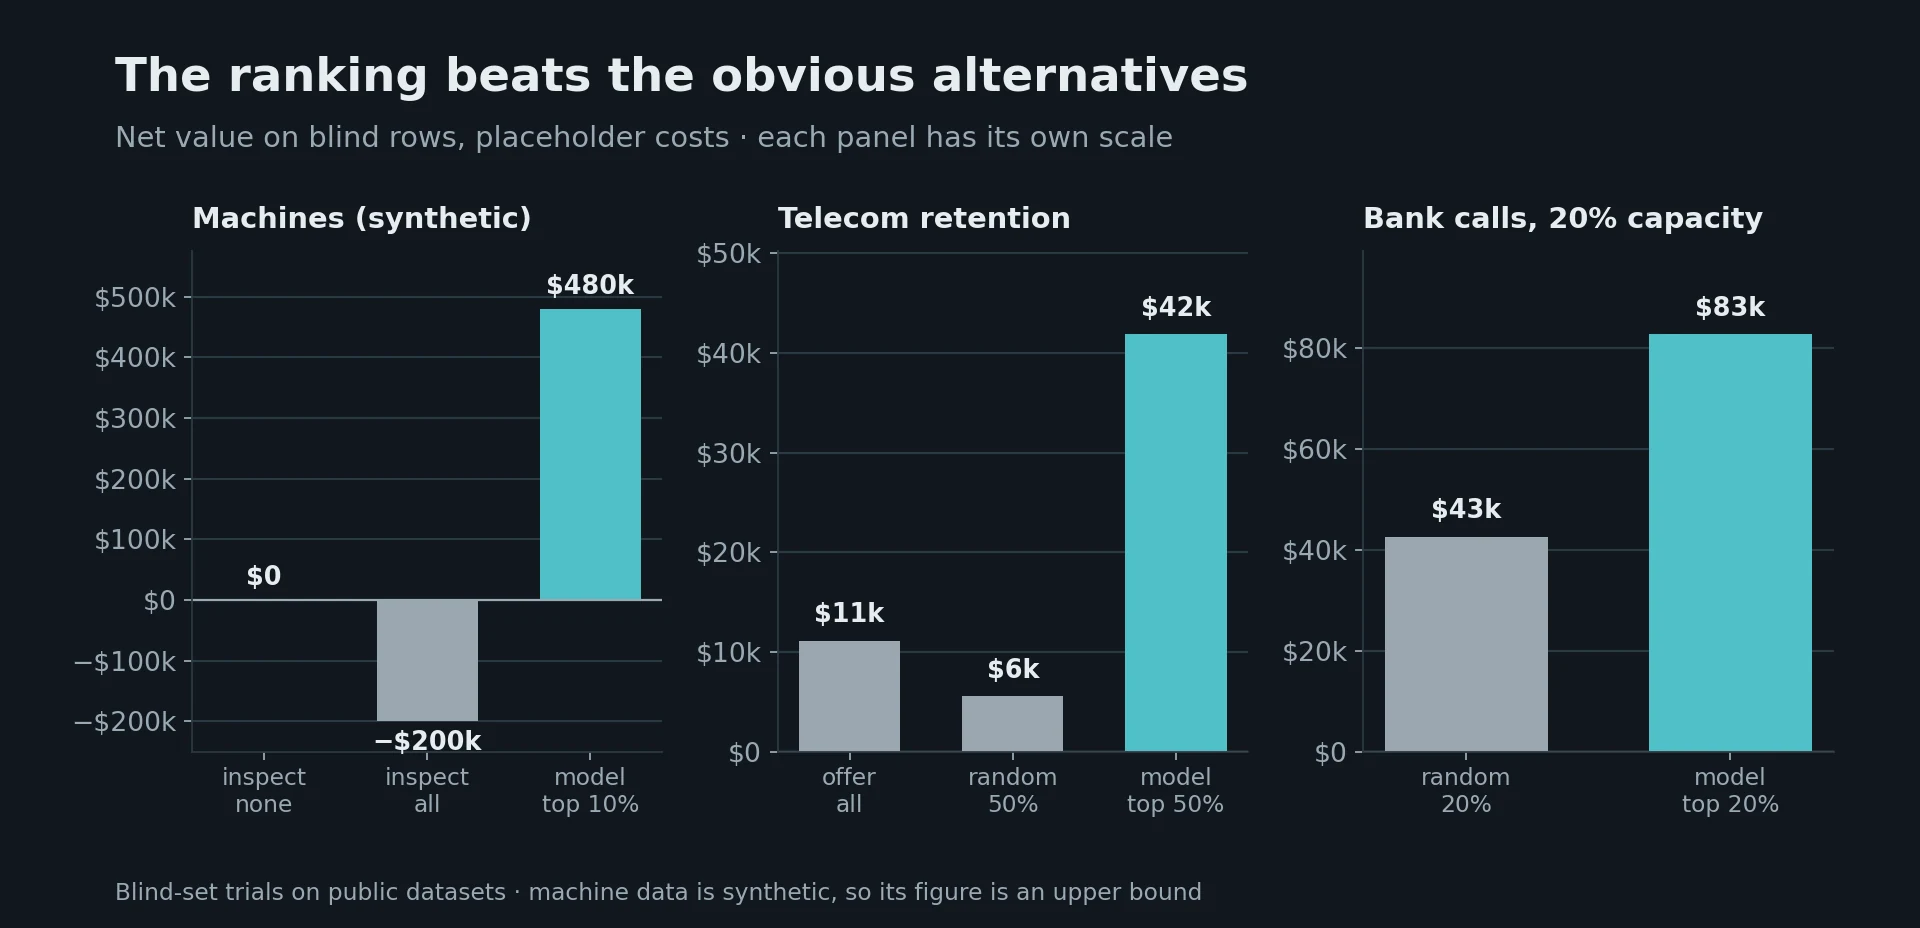
What the results mean: in all three cases the model's ranking concentrated the valuable cases at the top of the list — the top 10% of customers it flagged were almost three times as likely to leave as the average customer, and the top 10% of machine readings held 70 of the 75 failures.
What they do not mean: the dollar figures depend on the placeholder costs (for example, $60 per retention offer and $5 per call). The machine data is synthetic and follows fixed rules, so its near-perfect result should not be expected on real equipment. And in the bank case, when calls cost only $5 and capacity is unlimited, calling everyone earned more than any ranking.
Where predictive analytics pays — and where it does not
It pays when the decision is "who or what should we act on first?" and each action has a real cost:
- keeping customers (retention offers, account reviews);
- choosing which leads or prospects to contact;
- scheduling inspections or maintenance;
- prioritising collections, fraud reviews or support escalations.
It does not pay when:
- acting on everyone is cheap and unlimited — then just act on everyone;
- there is no record of past outcomes — a model learns from history, so it needs history;
- the list is tiny — a few hundred records rarely support a reliable model;
- the data contains little real signal — an honest evaluation will say so, and no tool can create signal that is not there.
What you need before you start
- One row per case — a customer, an order, a call, a machine reading — with one column recording what happened (left or stayed, bought or not).
- A few thousand past cases, with a reasonable number of each outcome.
- Only information that exists at the moment you will ask for a prediction. A column filled in after the event — a cancellation reason, the length of a sales call — makes a model look brilliant in testing and fail in use. This is target leakage, and it is the most common reason predictive analytics disappoints.
- A rough price on acting and on success — the cost of a call, an offer or an inspection, and what a kept customer or a sale is worth. Accuracy alone does not tell you whether to act; your costs do.
What predictive analytics costs
The model types that win most business problems — random forests, gradient boosting — are free and open source. What costs money is the work around them: preparing data, testing models fairly, checking for leaks, and keeping results repeatable. The options:
- Do it yourself with free tools such as KNIME, if someone on the team is comfortable building analysis workflows.
- Usage-based cloud services — Amazon SageMaker Canvas, Google Vertex AI, Azure Machine Learning — billed by the hour inside your own cloud account.
- Enterprise platforms such as DataRobot, sold by quote; third-party purchase data puts the median DataRobot contract at about $212,000 a year (comparison).
- YourCloudGroup Model Manager at a fixed price on a dedicated server: $25 a day, $150 a week, $499 a month or $4,788 a year.
Which tools build predictive models from a CSV file? compares seven options side by side.
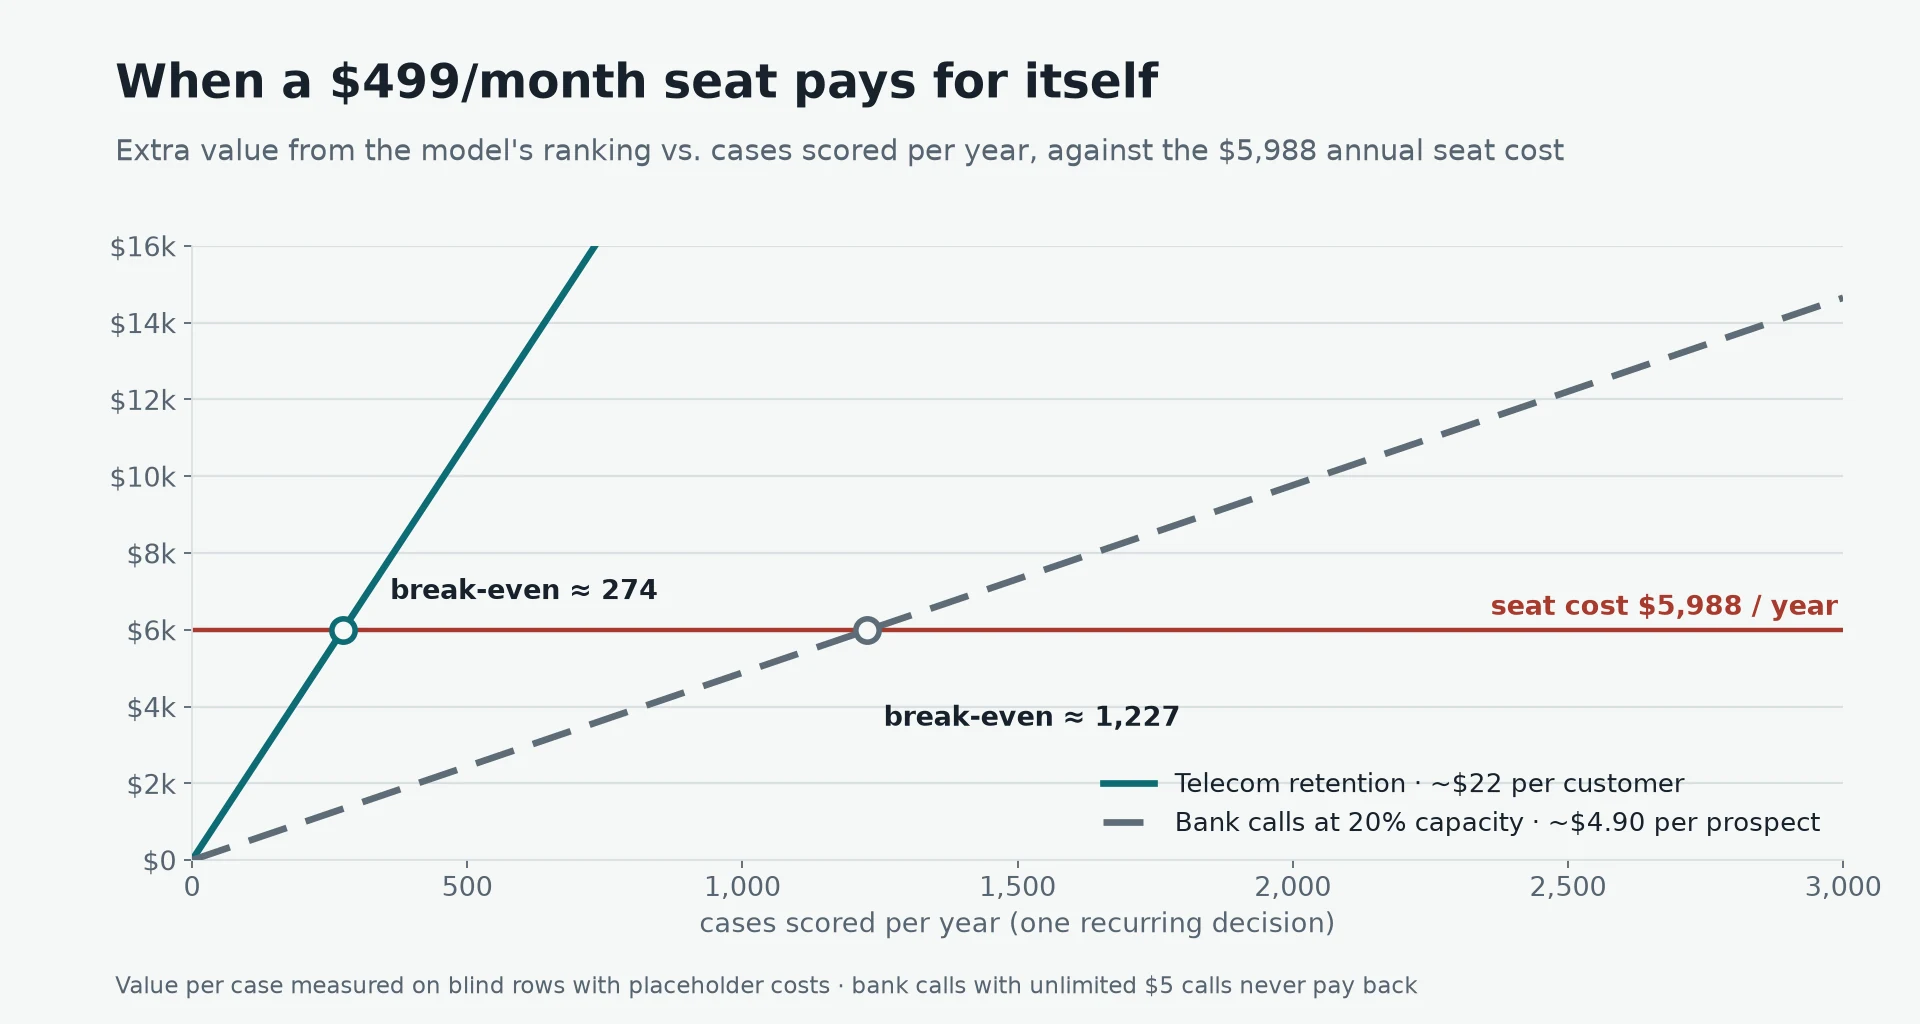
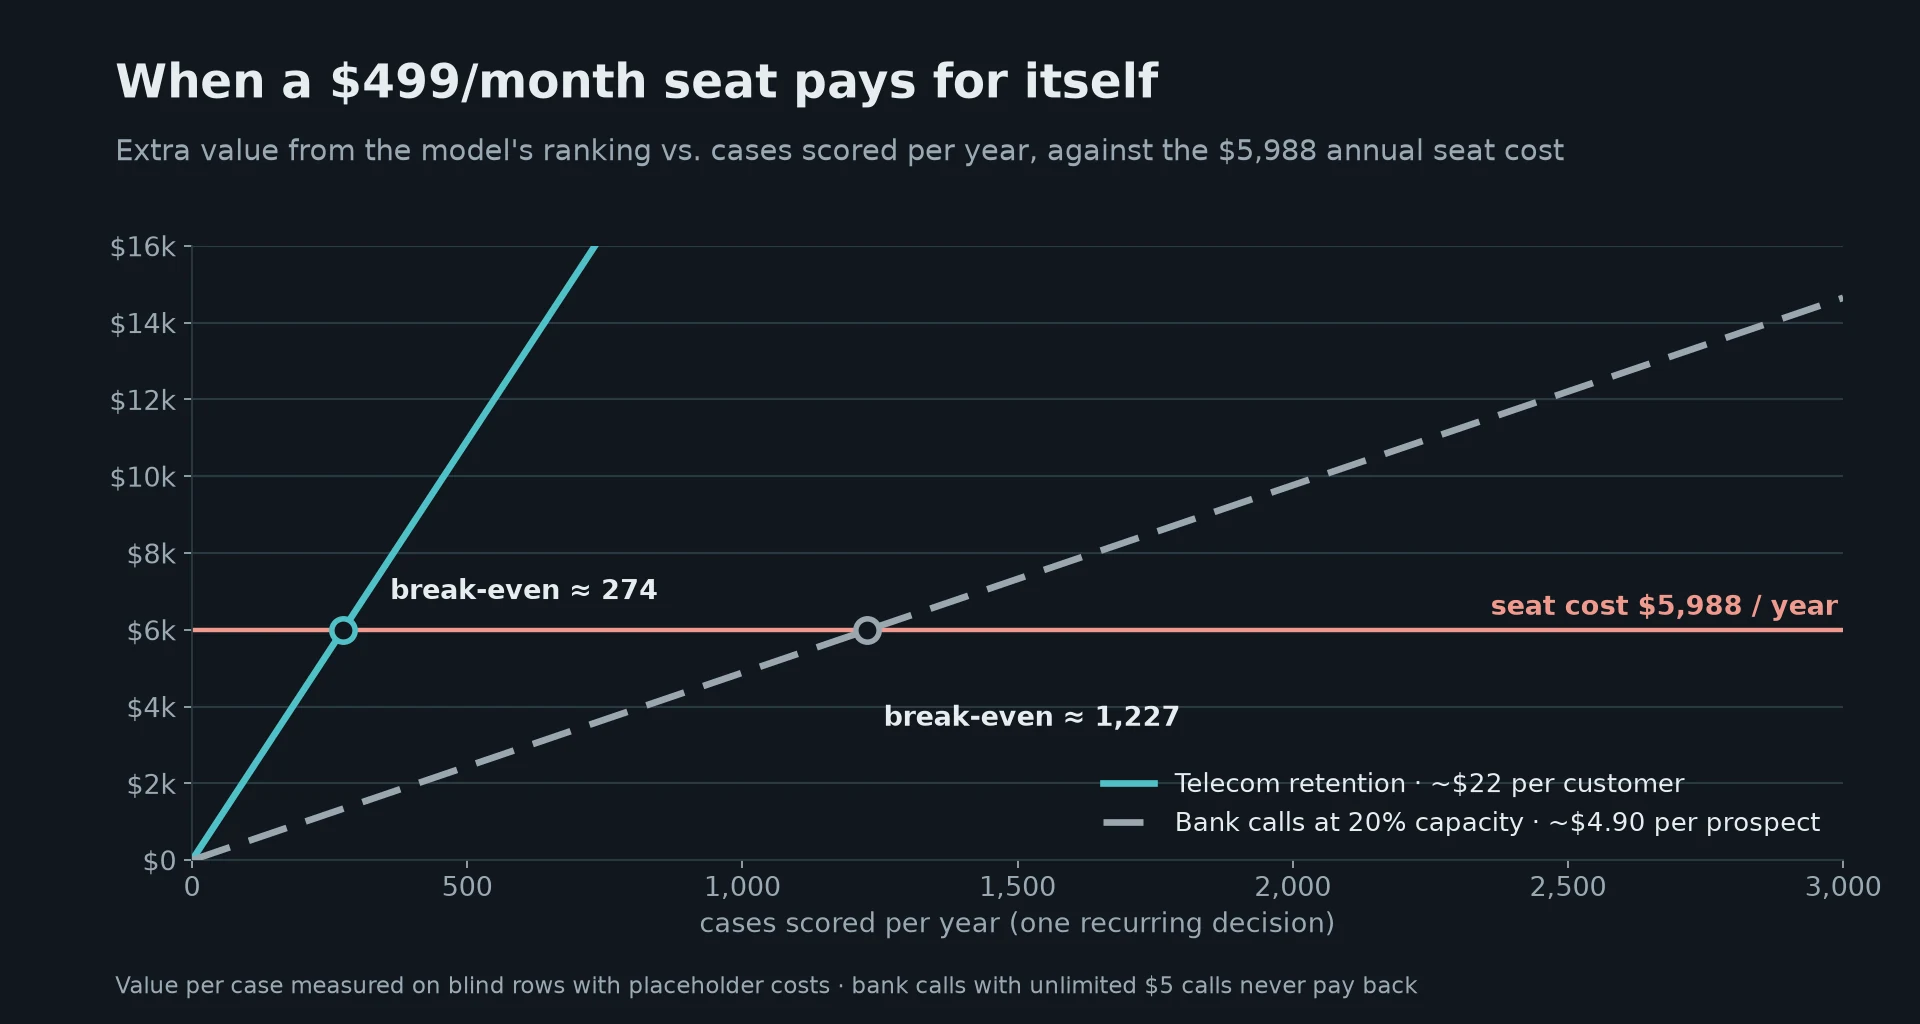
When does a fixed-price tool pay for itself? On the measured value per case above, a $499-a-month subscription ($5,988 a year) is covered by about 274 customers a year at retention stakes, or about 1,227 prospects a year at call-centre stakes. On the annual plan the figures fall by a fifth.
How to start, in six steps
- Pick one decision with a clear cost and value — the next retention campaign, the next call list.
- Export the history as a spreadsheet: one row per past case, the outcome in one column, and a date if you have one.
- Remove or flag columns recorded after the outcome, and have someone who knows the data confirm them.
- Build and test models on records held back from training — never judge a model on the data it learned from (held-out evaluation).
- Convert the ranking into dollars with your own costs, and choose how far down the list to act.
- Pilot it alongside current practice for one cycle, then compare the results and re-check the model against the new outcomes.
Limitations
The examples use public datasets and placeholder costs; they illustrate the method and are not forecasts for any particular business. They tested yes/no outcomes only — numeric forecasts such as next month's sales were not part of these trials. Models also go stale: in the bank data, the share of calls that converted rose from 11% to 31% between the training and test periods, which is why results should be re-checked against fresh outcomes every quarter.
Takeaway
Predictive analytics is worth it for a small business when there is a repeated decision about priority, a few thousand past cases with known outcomes, and a real cost per action. Start with one decision, test on records the model never saw, and judge it in dollars against what you do today.
Build predictive models from your own data
YourCloudGroup Model Manager builds, evaluates, certifies and schedules predictive models from your CSV or spreadsheet data — point and click, on your own dedicated server.
Learn about Model Manager →Published by YourCloudGroup. Read our editorial standards and corrections policy.


