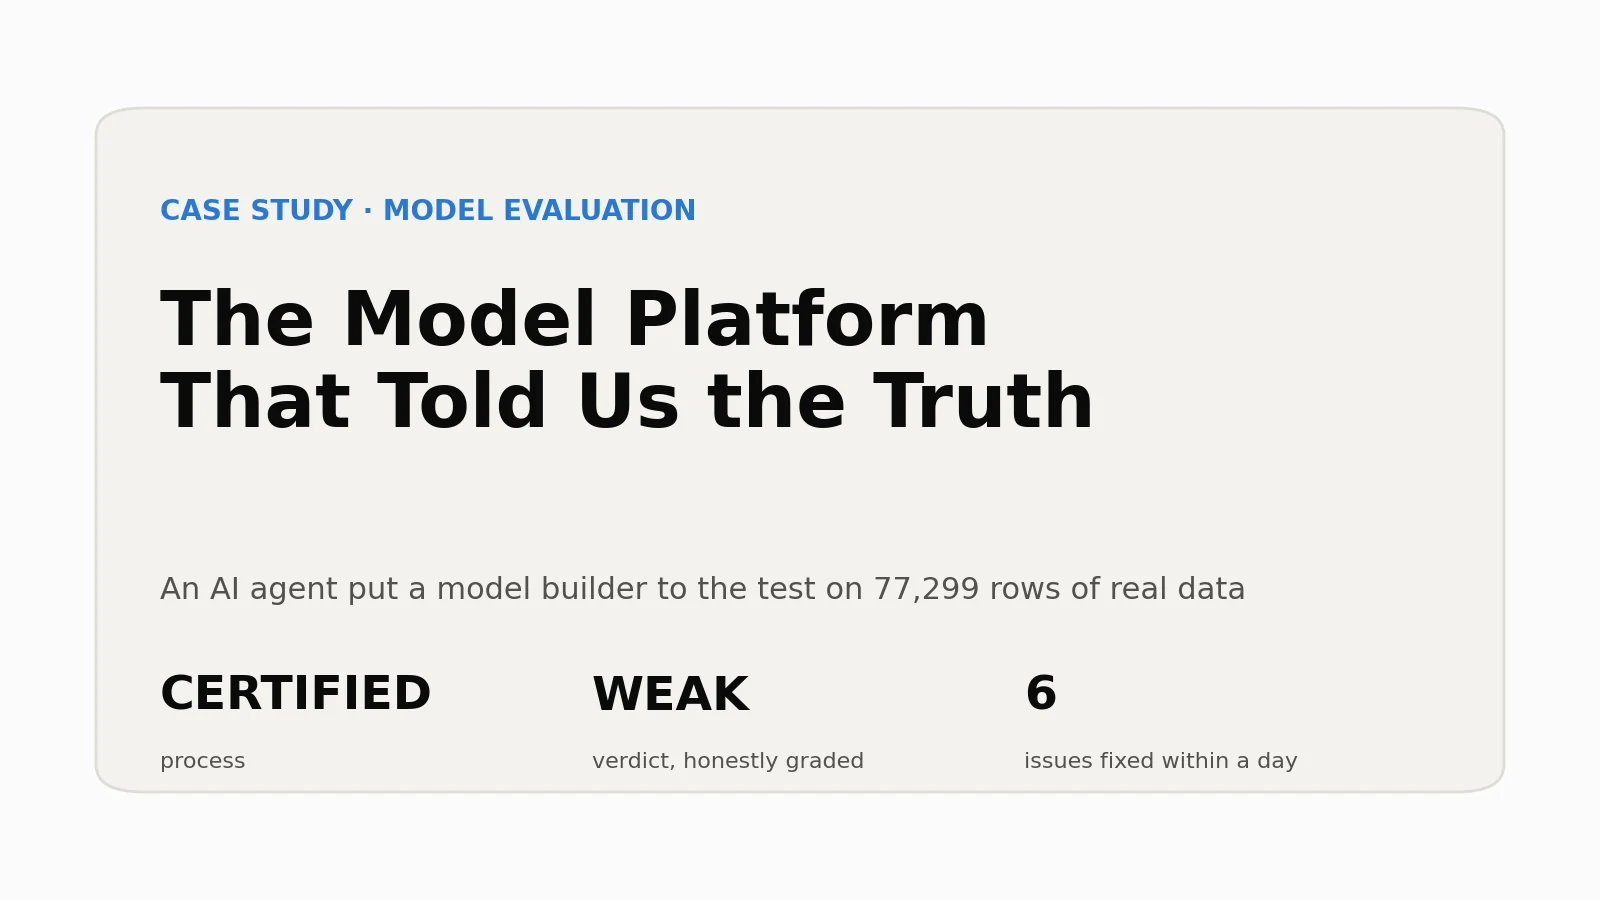
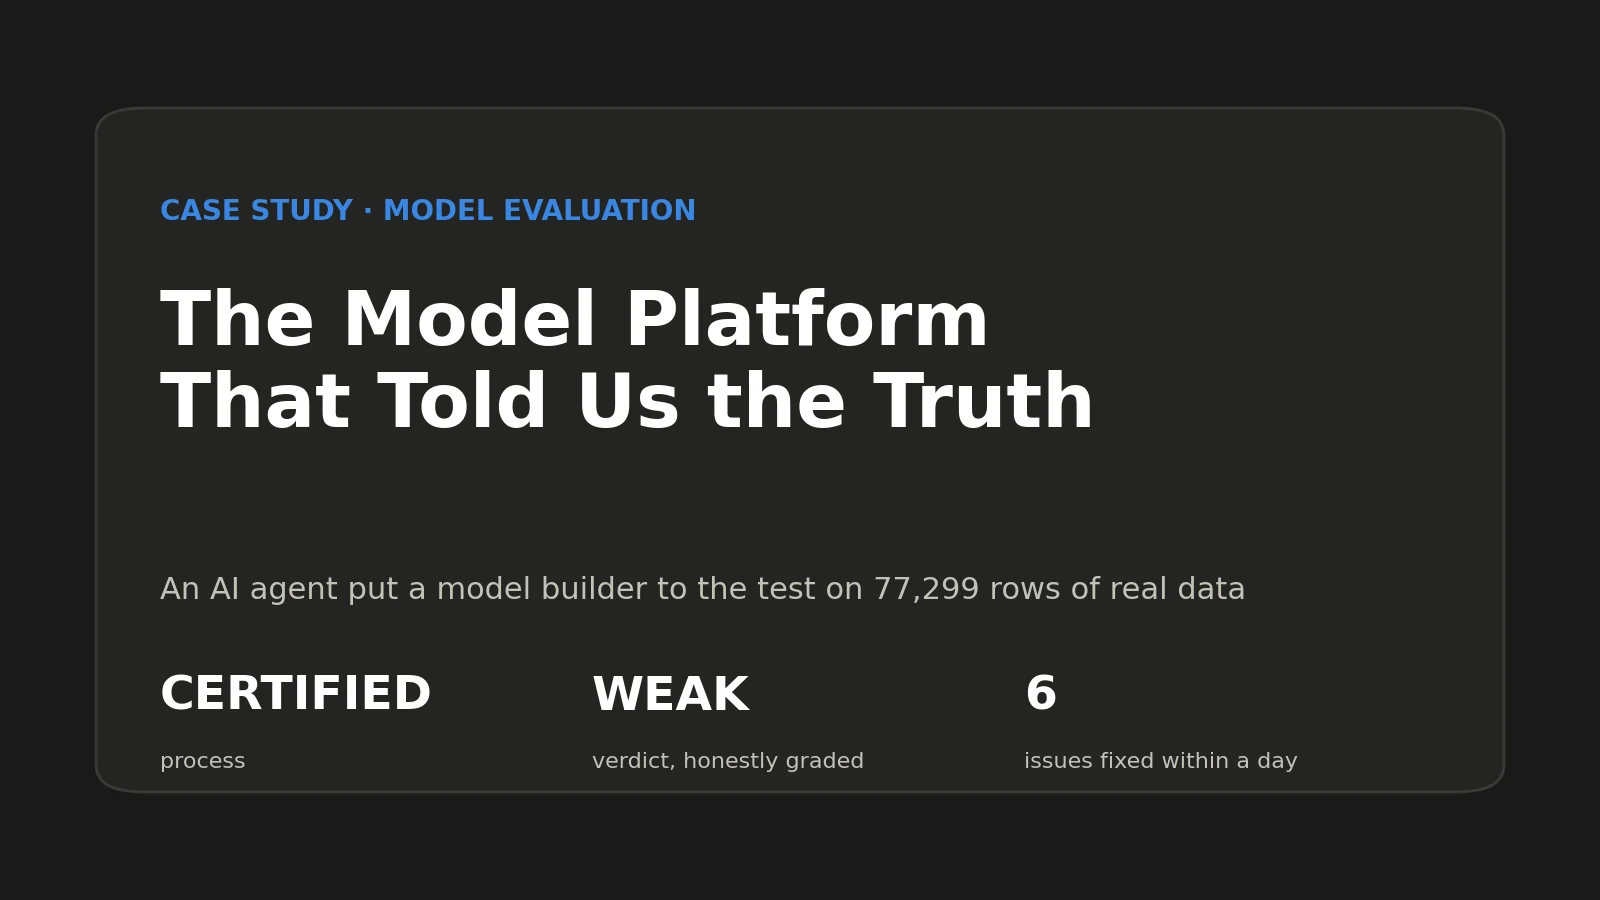
Predictions from Business Spreadsheets: What a YourCloudGroup Seat Delivers
Blind-set trials on three public datasets, converted into dollars: which machines to inspect, which customers to keep, which prospects to call — and when a seat pays for itself at $499 a month or $4,788 a year.
In this article
- What we found
- Results at a glance
- Machines: which to inspect
- Telecom: who gets a retention offer
- Banking: who to call in a deposit campaign
- Is a seat worth it? The agent's assessment
- When a spreadsheet is ready
- Scorecard (criteria set before the runs)
- What the seat does well — and its current limits
- What these trials show — and what they do not
- How to get started
- Method and sources
Can a business hand a spreadsheet of past cases to YourCloudGroup Model Manager and get predictions it can trust and act on? An AI agent tested exactly that on three typical business problems — which machines to inspect, which customers to offer a retention deal, and which prospects to call — running each end to end on a YourCloudGroup seat, a dedicated private server running the platform. Every model was judged only on records it had never seen, and every result was converted into dollars.
The answer: the seat pays off when the decision is about priority. It ranks the list so that effort goes where it pays. It does not oversell, and it is not magic: when actions are cheap and unlimited, acting on everyone can still beat any ranking.
These trials were run by an AI research agent (Claude) on 30 September 2026. It is not an endorsement by Anthropic. Dollar figures use placeholder costs, stated with each case; the machine data is synthetic.
What we found
- Ranking pays. 70 of 75 machine failures were in the top 10% the model flagged, and the top 10% of customers it flagged were almost three times as likely to leave as the average customer.
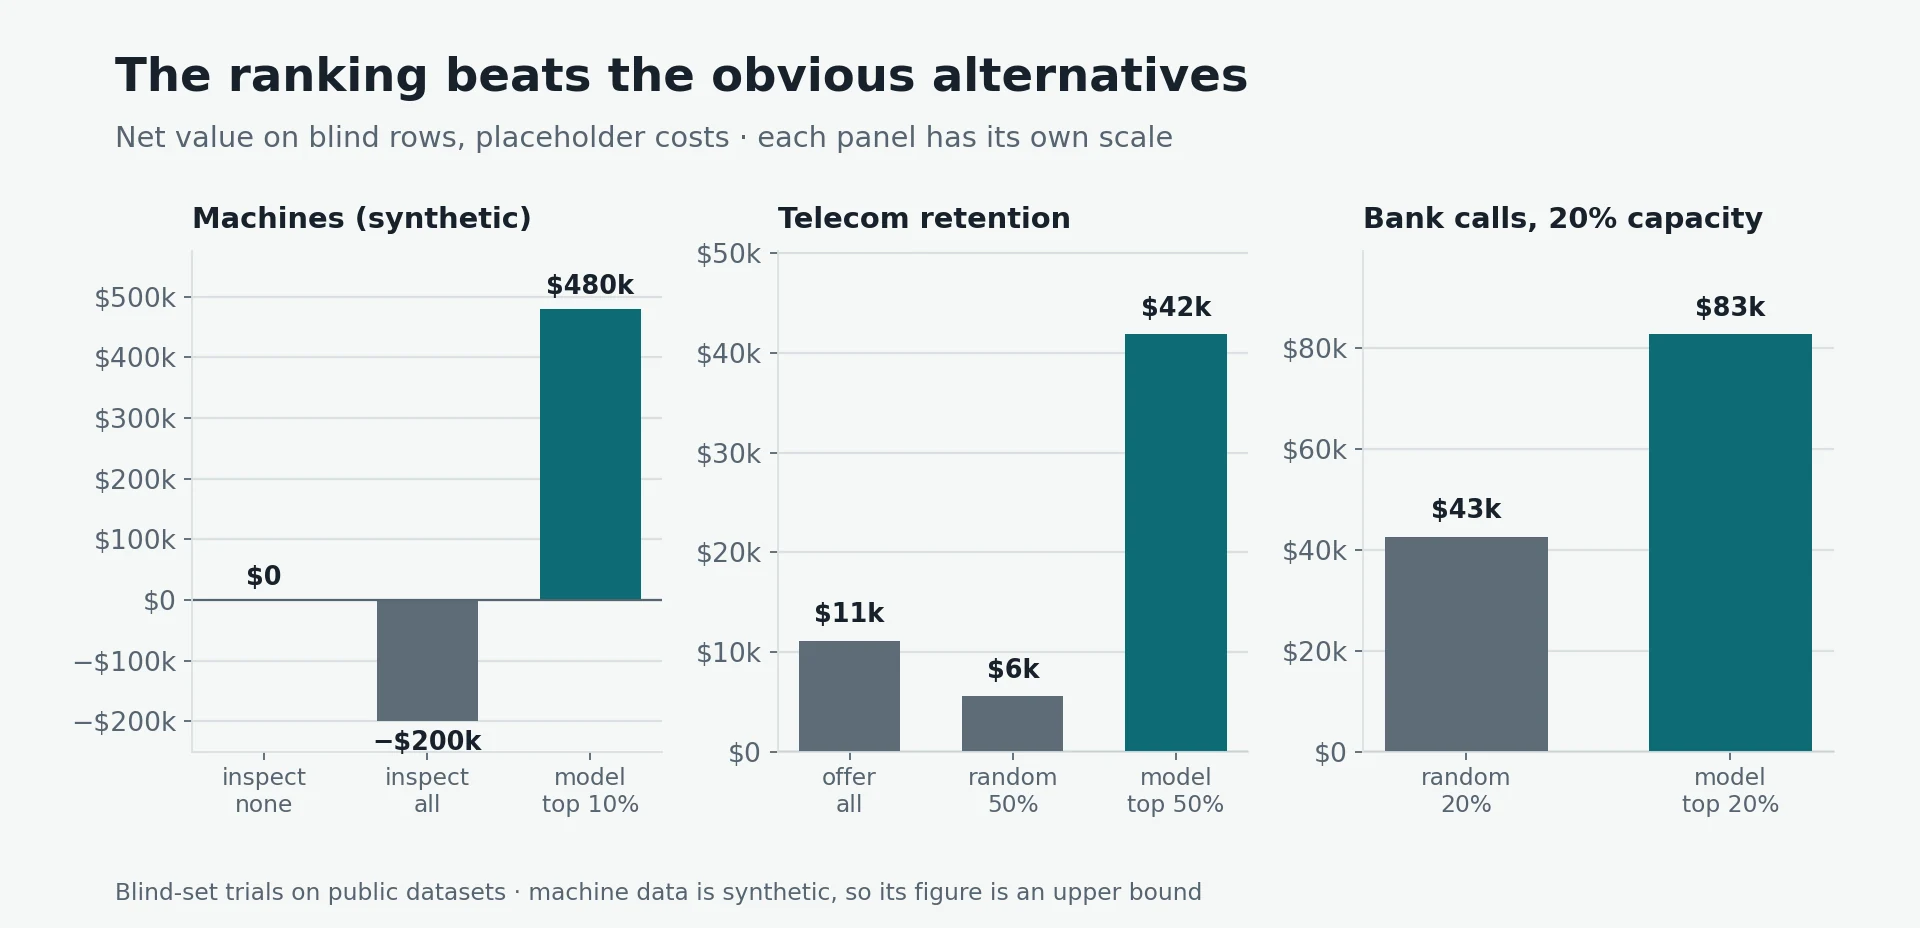
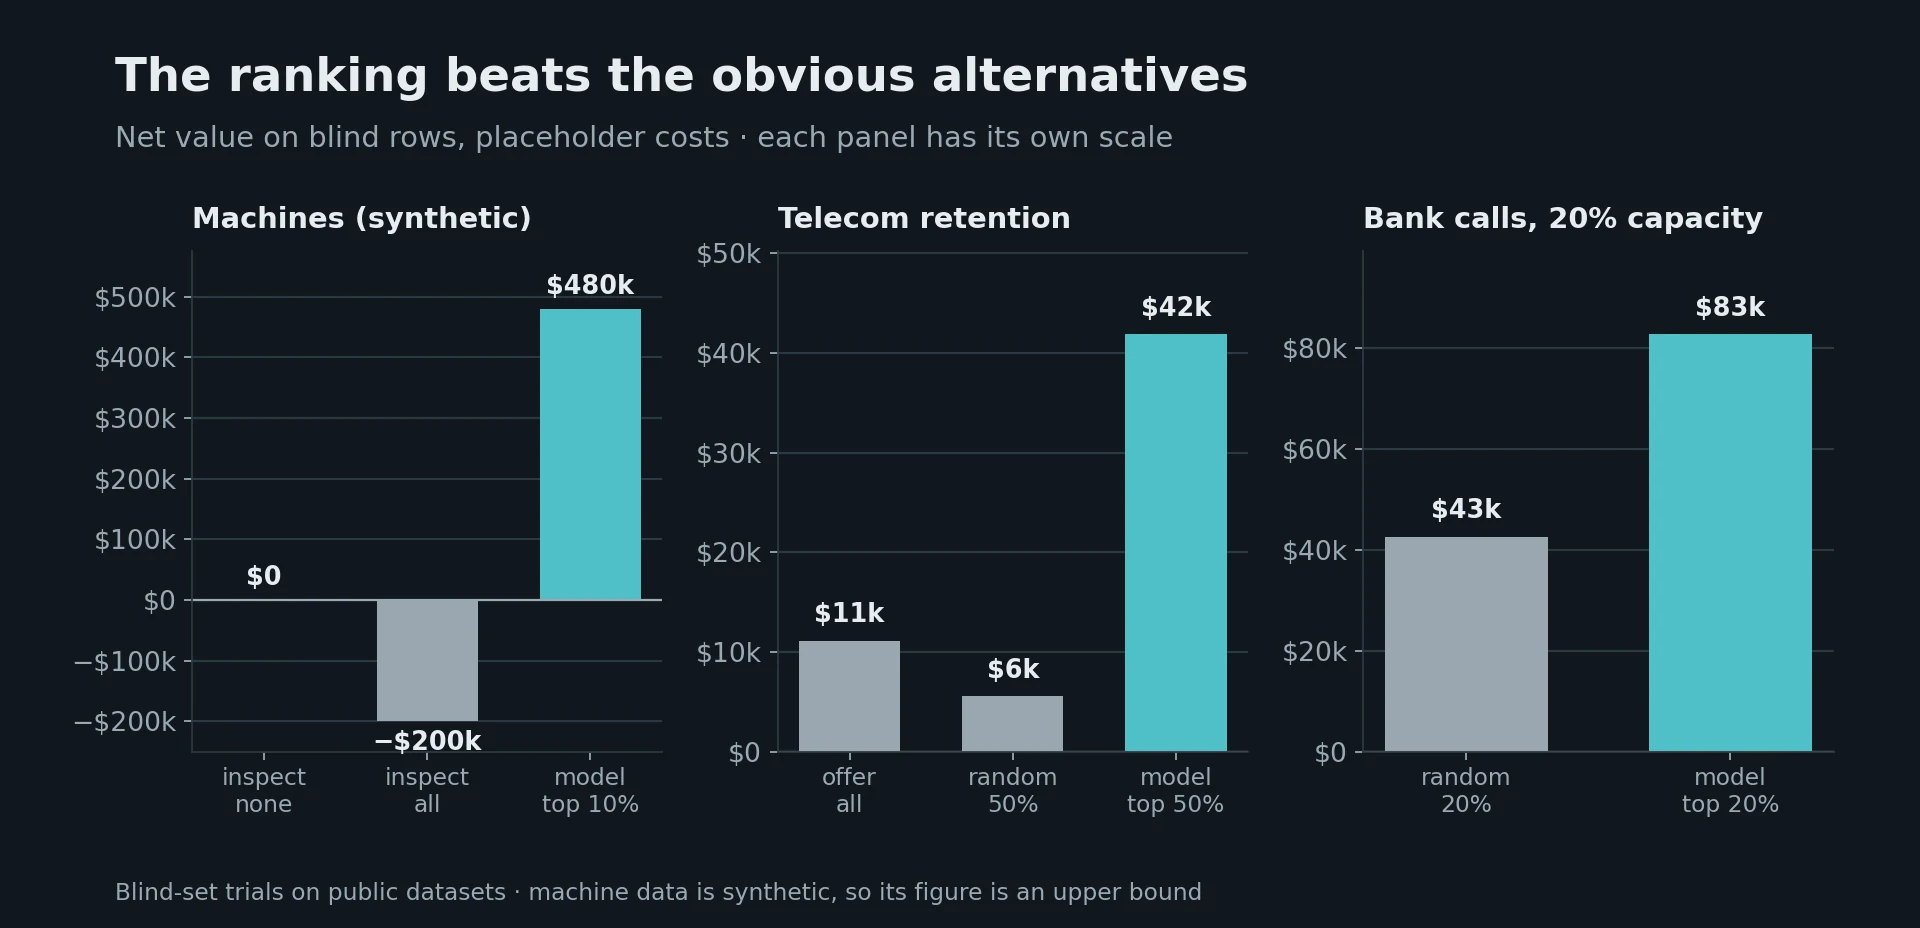
- Money made, on placeholder costs: about $480,000 saved on the machine data (synthetic), $42,000 net on customer retention against $11,000 for treating everyone, and nearly twice the result of random calling when a call centre can reach only one in five prospects.
- It does not oversell. It caught the classic data mistakes on its own, gave identical results when the work was repeated, and labelled anything it could not prove as "not assessed" rather than guessing.
- It is not magic. When calls are cheap and the market shifts, as in the banking case, contacting everyone can still beat any ranking. Your own costs decide whether a prediction is worth using.
Results at a glance
| Machines | Telco churn | Bank calls | |
|---|---|---|---|
| Business question | Which machines to inspect | Who gets a retention offer | Who to call in a deposit campaign |
| Data | AI4I 2020, 10,000 readings (synthetic), 3.4% fail | IBM Telco, 7,043 customers, 26.5% churn | UCI Bank Marketing, 41,188 calls, 2008–2010 |
| Headline | $480k saved on 2,000 blind readings | $42k net vs $11k offering everyone | 1.9× random calling's profit at 20% capacity |
| Hit rate, top 10% | 35% vs 3.7% base (9×); 93% of failures caught | 72% vs 25% base (2.9×) | 63% vs 31% base (2.0×) |
| Ranking quality (AUC) | 0.98 | 0.83 | 0.72 |
| Winning model | XGBoost | Random forest | Random forest |
Dollar figures use placeholder costs. Replace them with your own; the model's ranking does not change.
Machines: which to inspect
$480k saved on 2,000 blind readings (synthetic data) by inspecting the top 10% that the model flags. Failures in this dataset follow fixed rules on the sensor readings, so near-perfect ranking is expected.
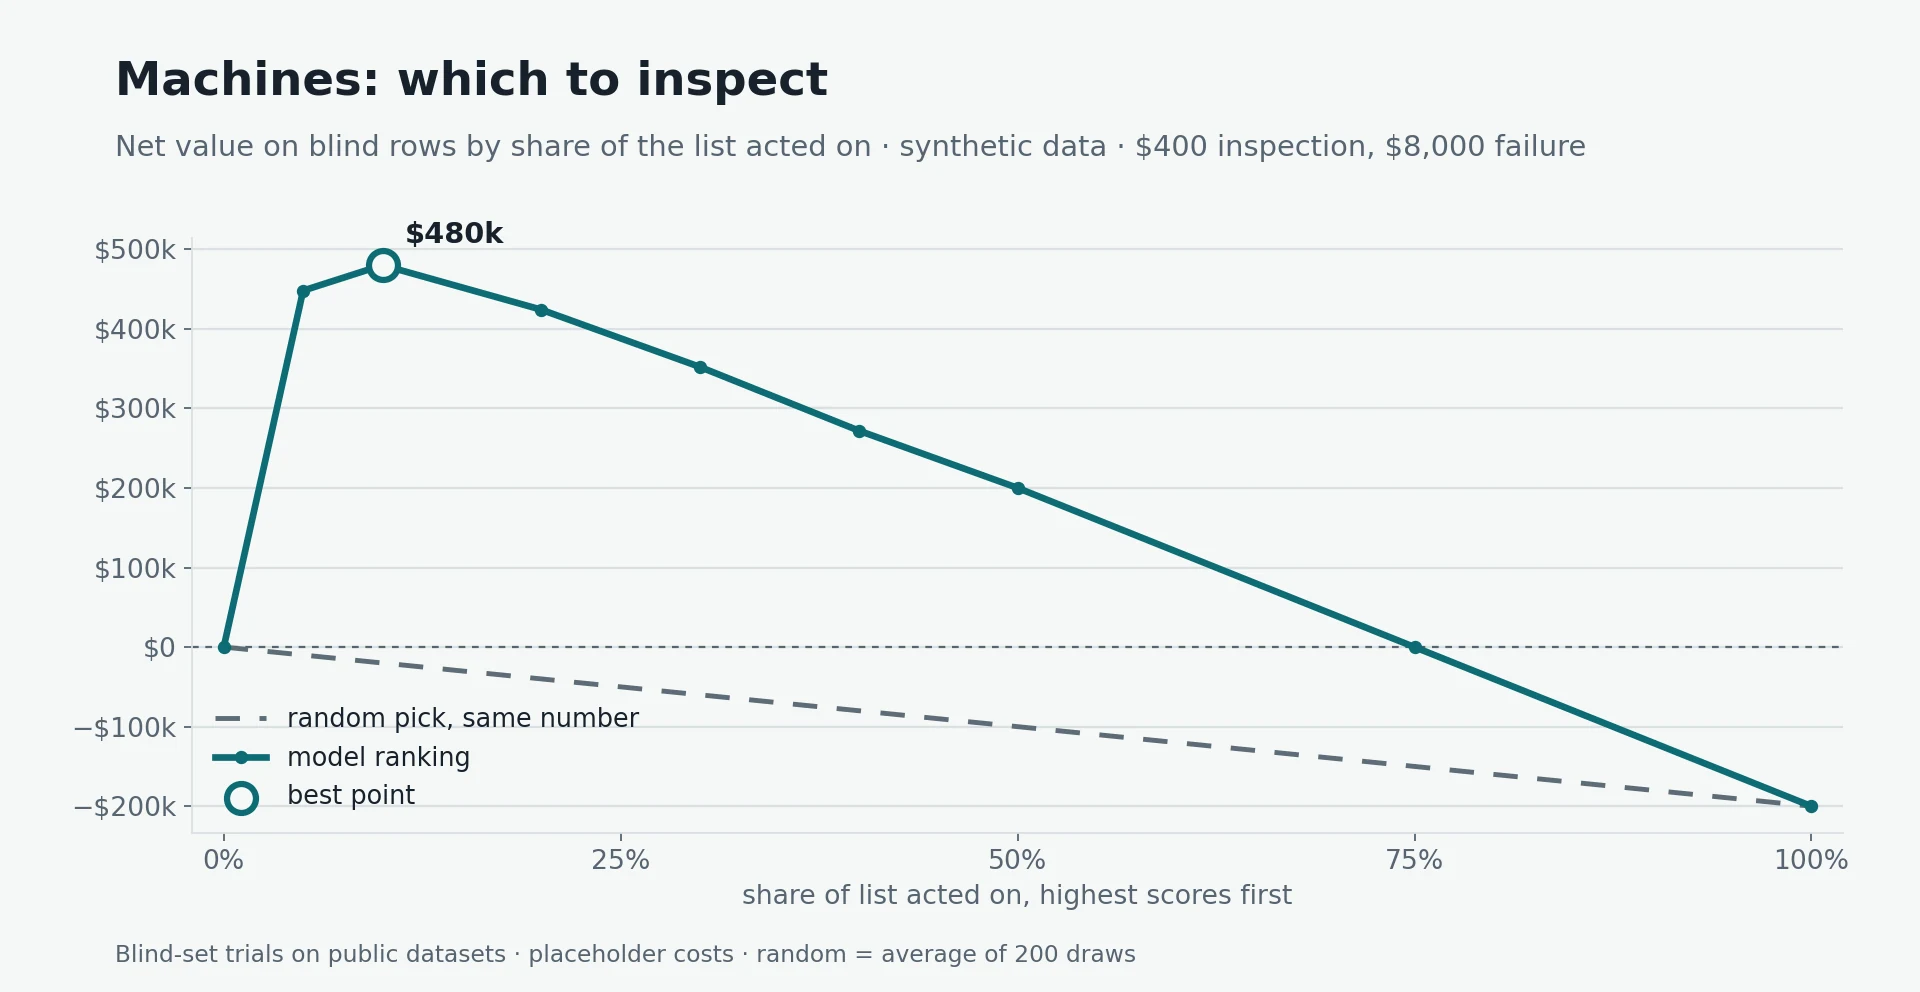
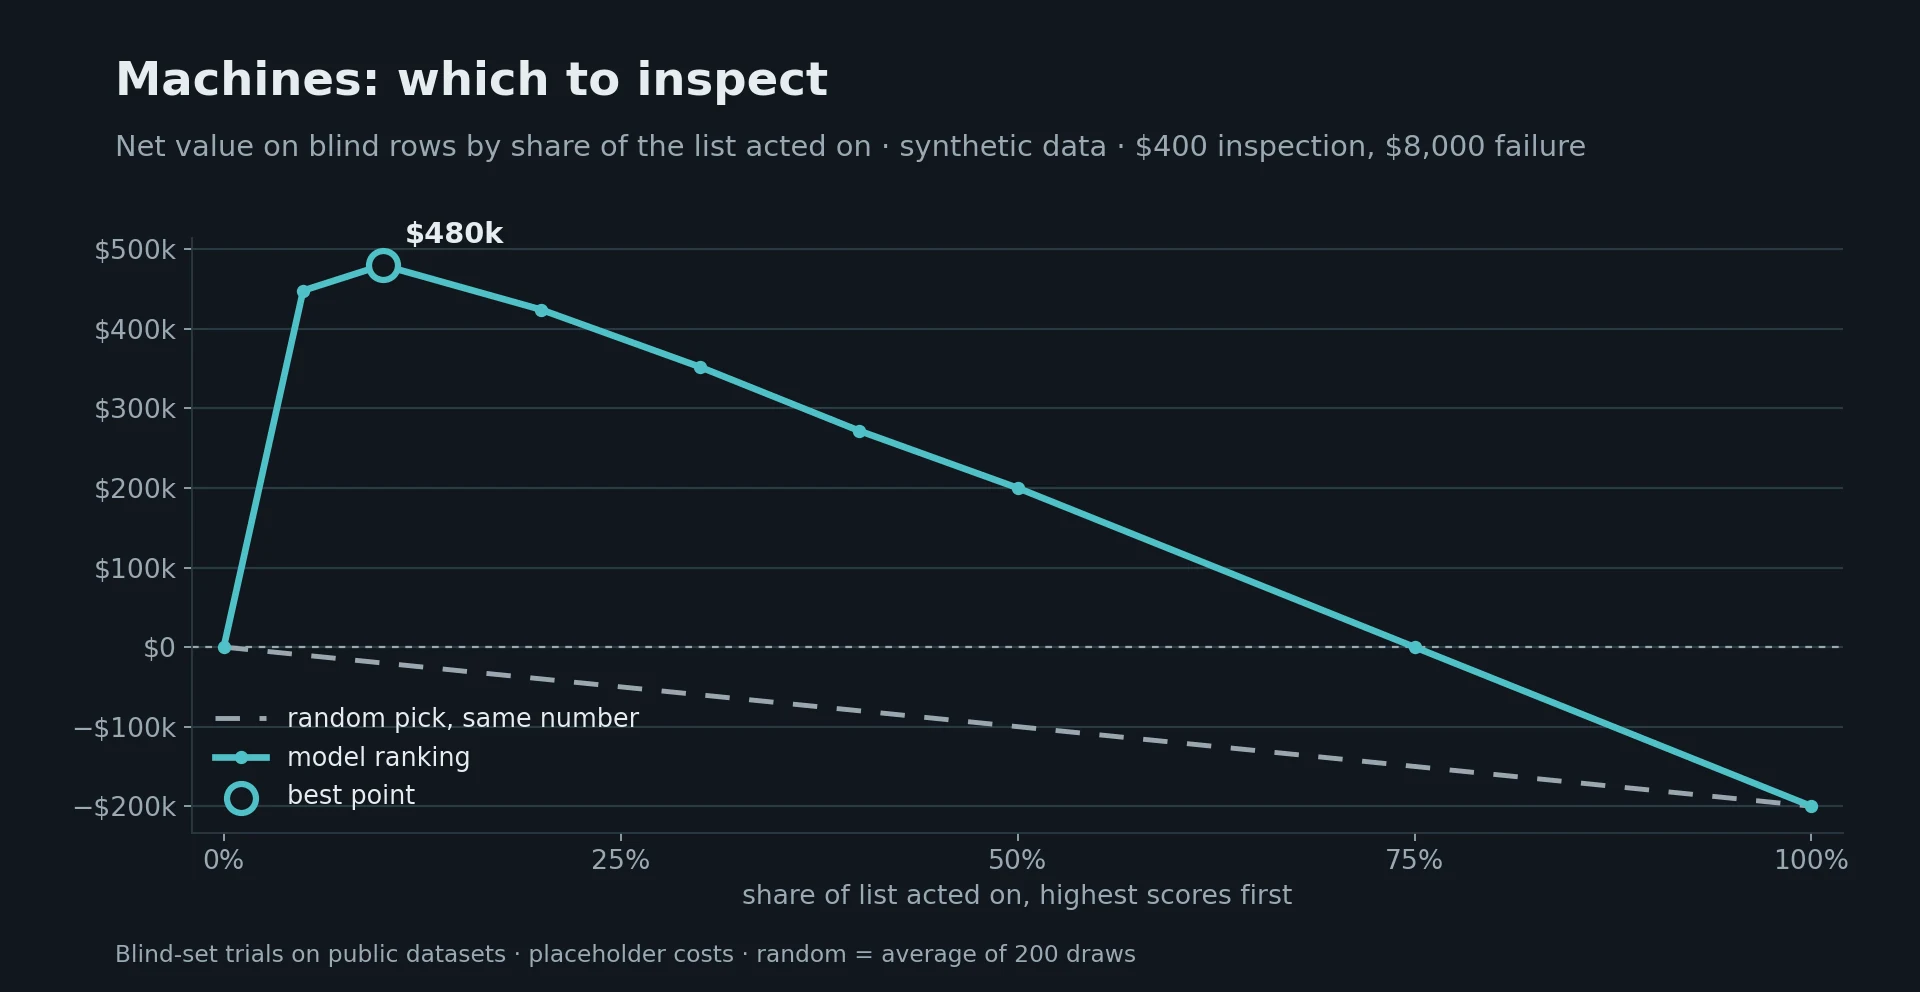
- Assumptions: $400 per inspection. An inspection prevents that failure, and an unprevented failure costs $8,000. Inspecting everything loses $200k.
- The seat's leak check: it flagged four failure-mode labels (TWF, HDF, PWF, OSF) together as a leakage risk and kept them out, and flagged the UDI row number as an identifier. RNF (random failures) barely tracks the outcome — 18 of its 19 flagged rows are non-failures — so the seat does not treat it as a leak; the operator excluded it, with a recorded reason.
Telecom: who gets a retention offer
$42k net from making offers to the top half of 1,408 blind customers, against $11k for offering everyone.
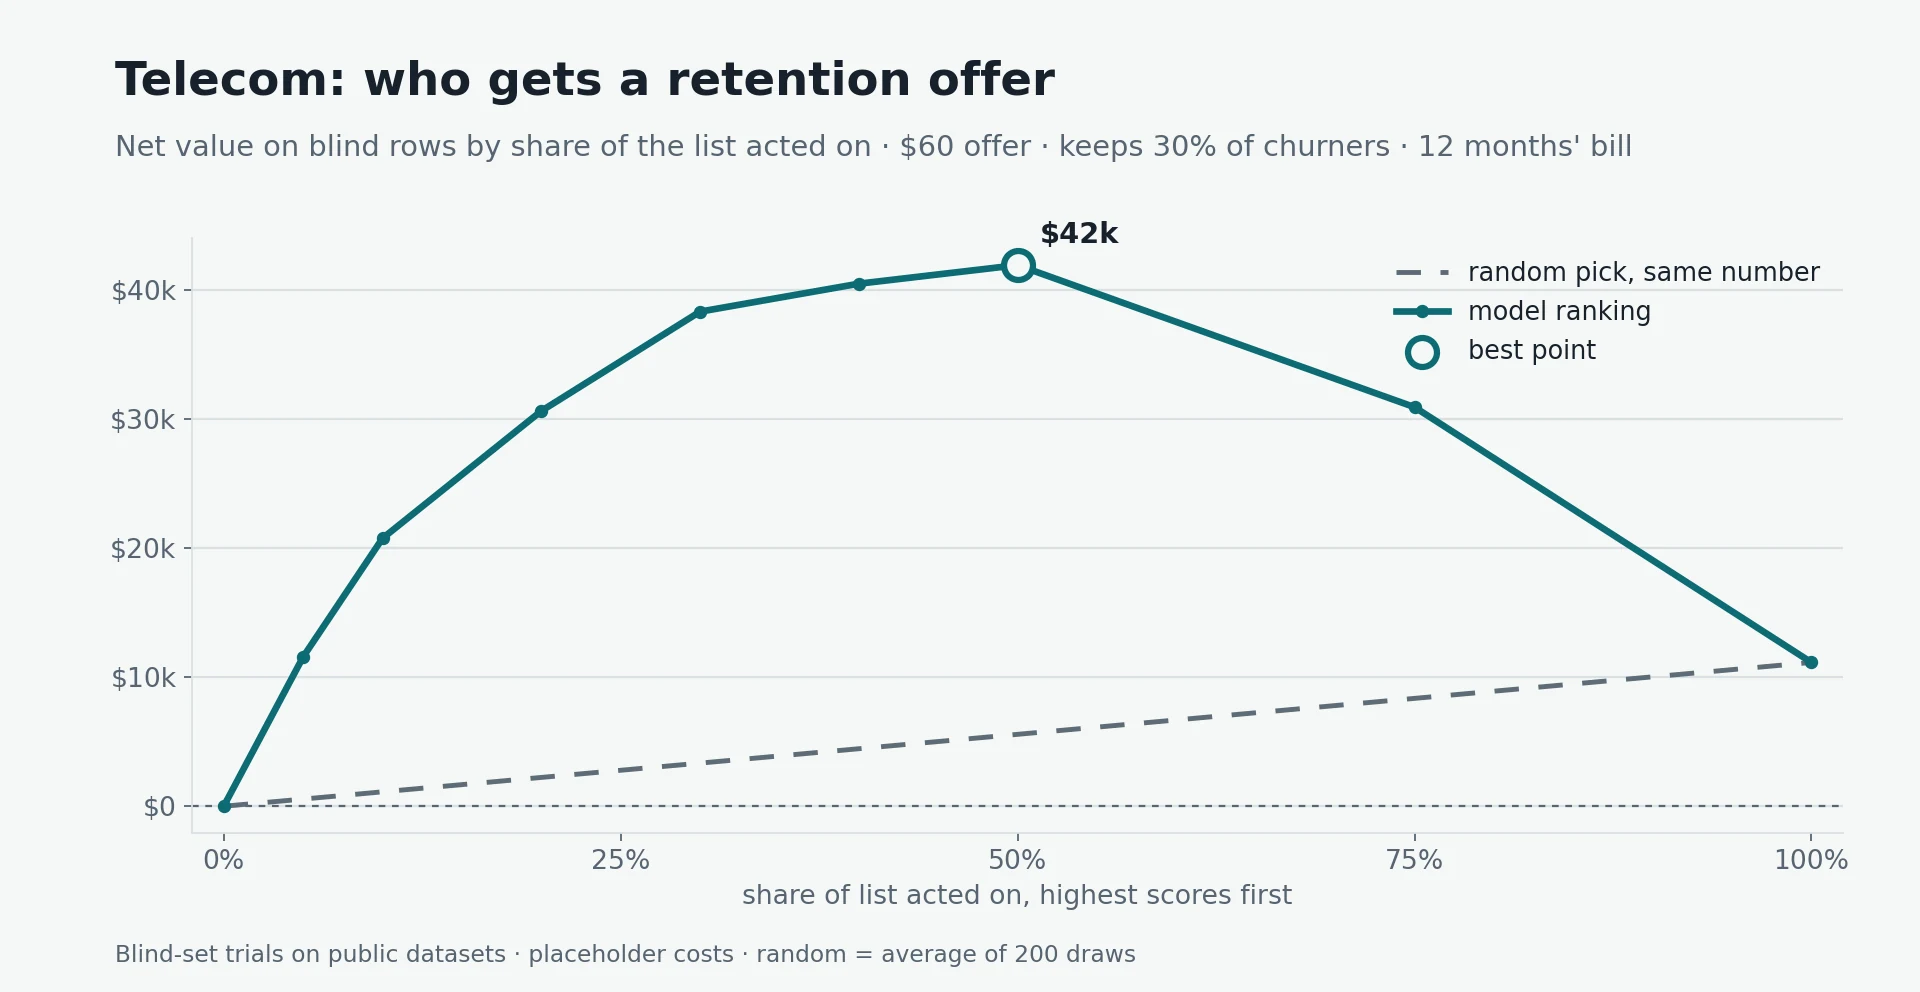
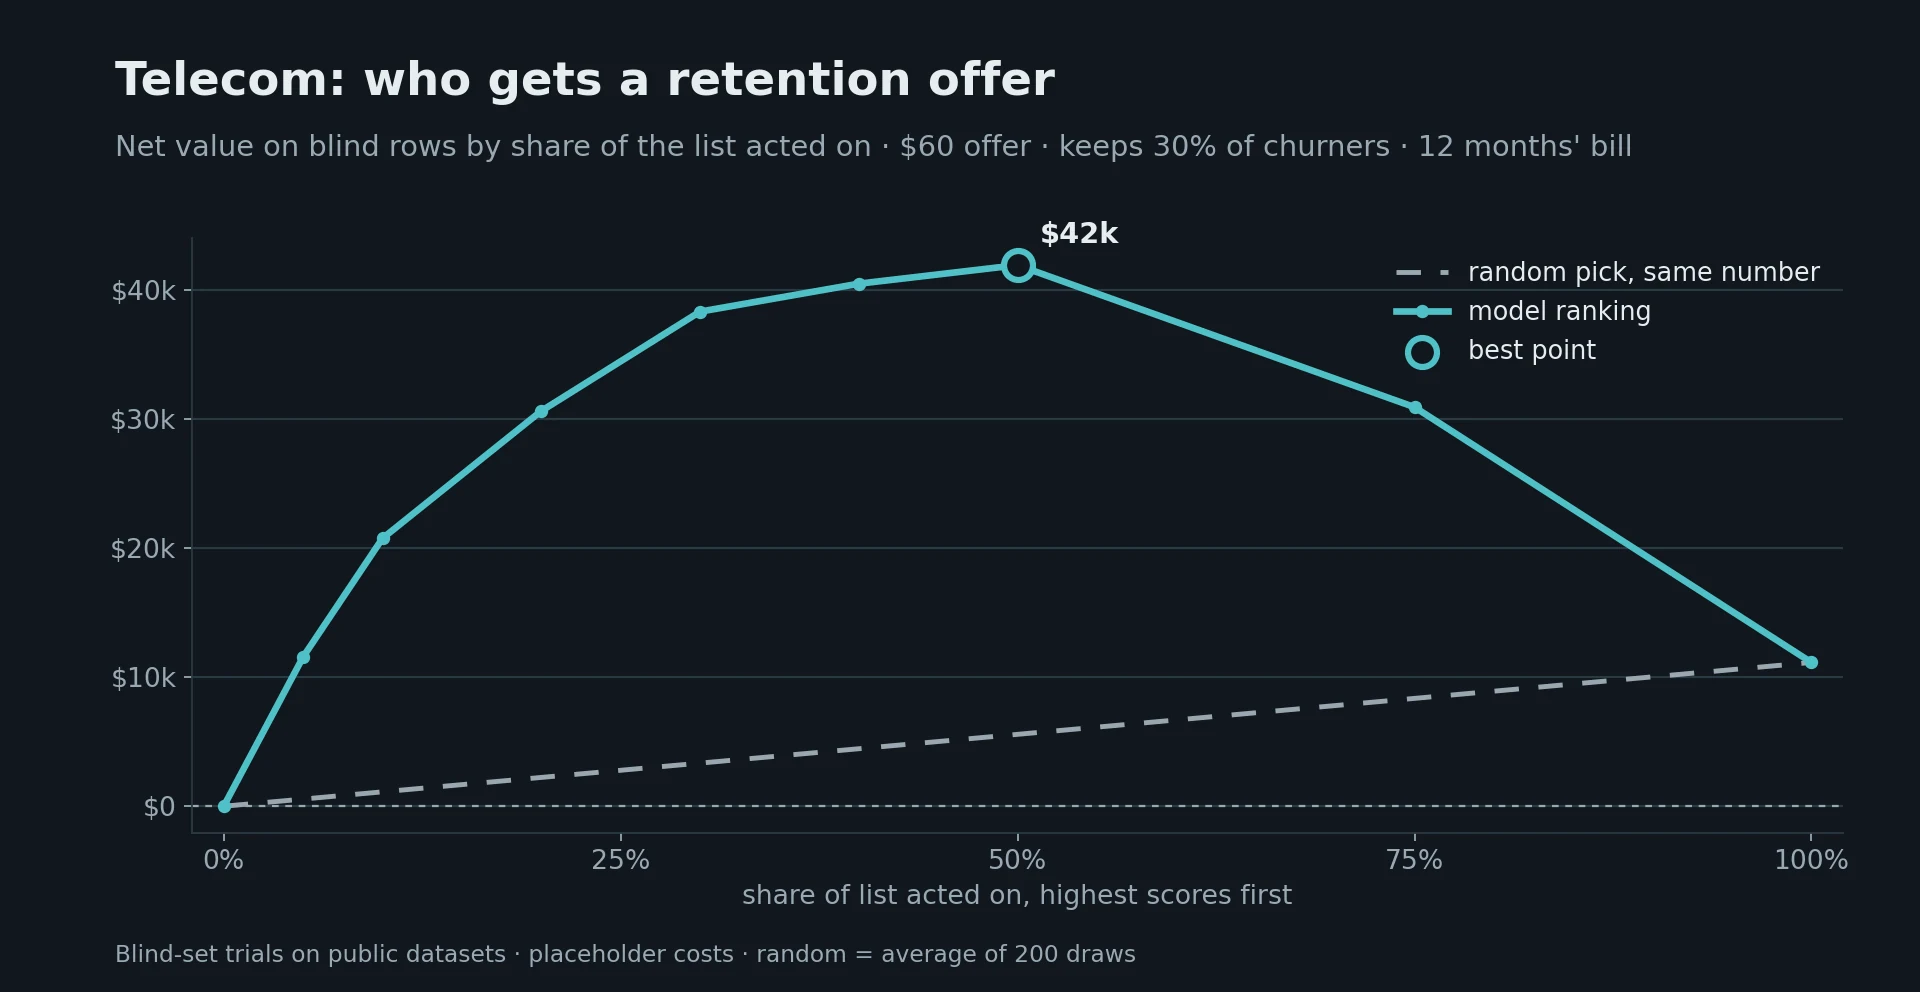
- Assumptions: $60 per offer. The offer keeps 30% of real churners, and a kept customer is worth 12 months of their bill.
- The seat's leak check: clean. It excluded the customer ID and passed everything else.
Banking: who to call in a deposit campaign
1.9× the profit of random calling when the call centre can reach only 20% of the list ($83k against $43k).
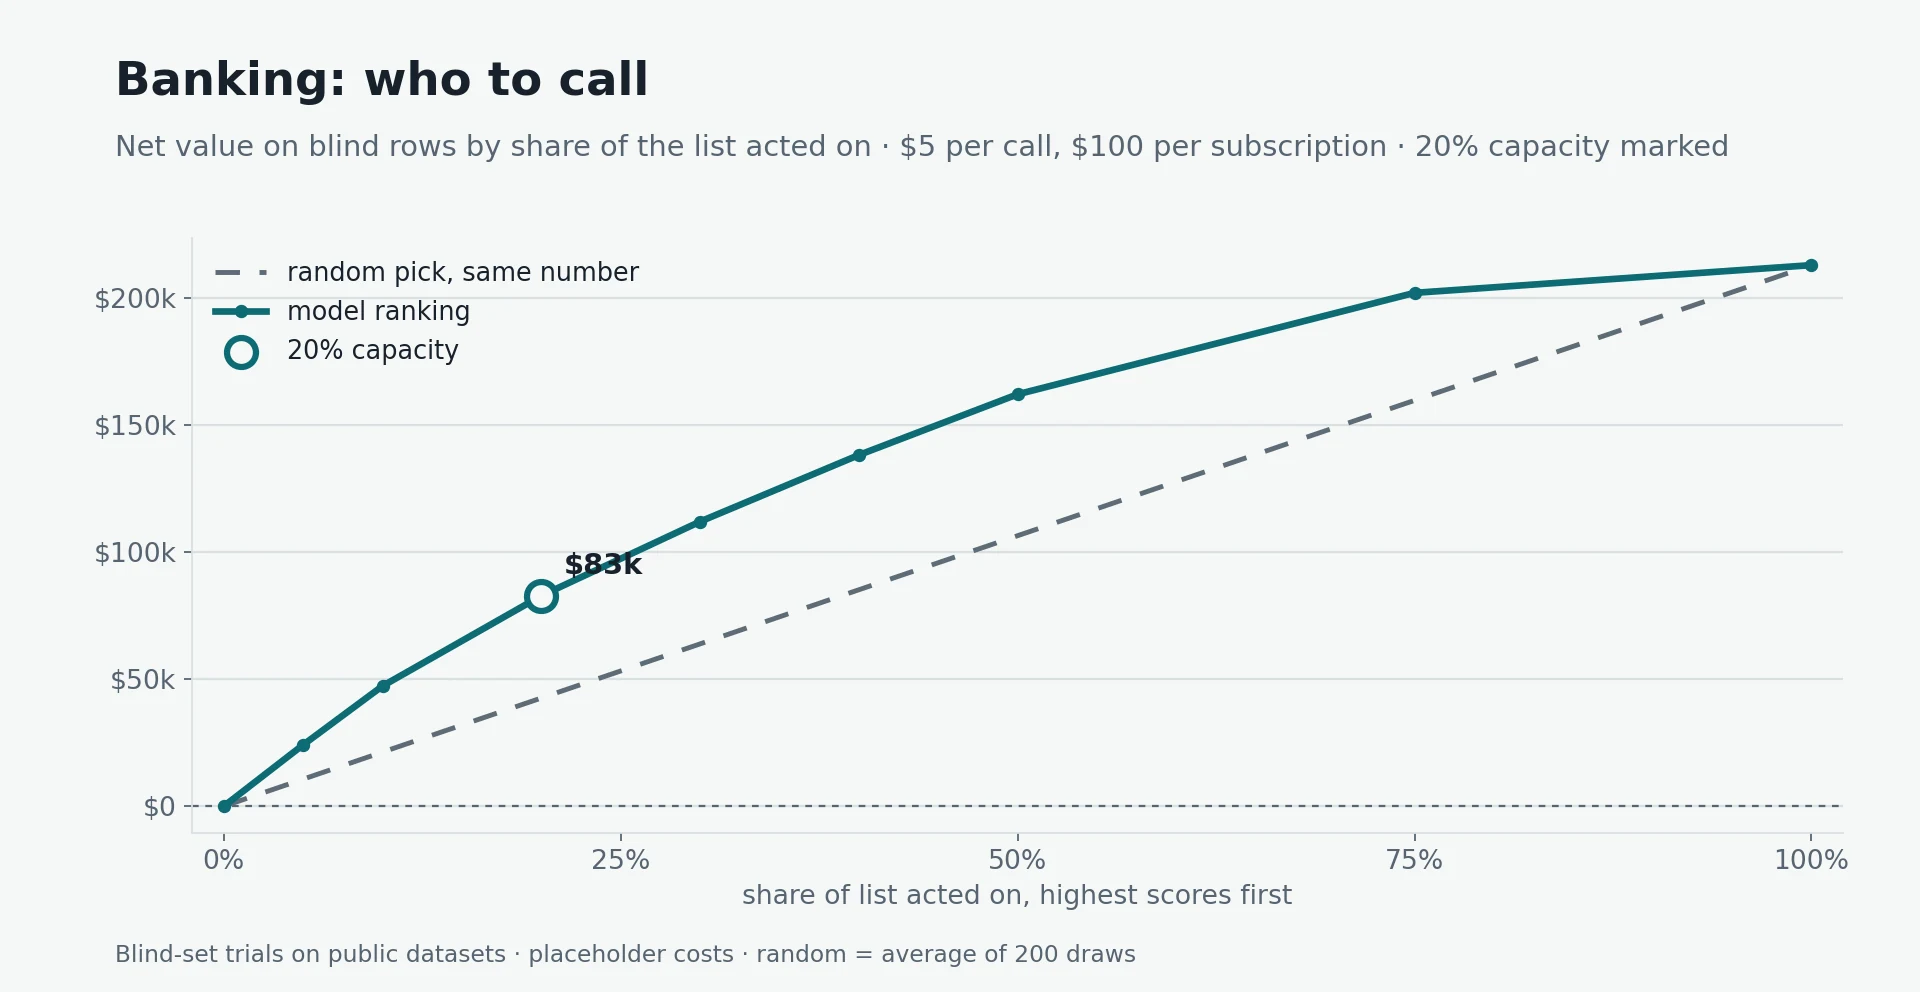
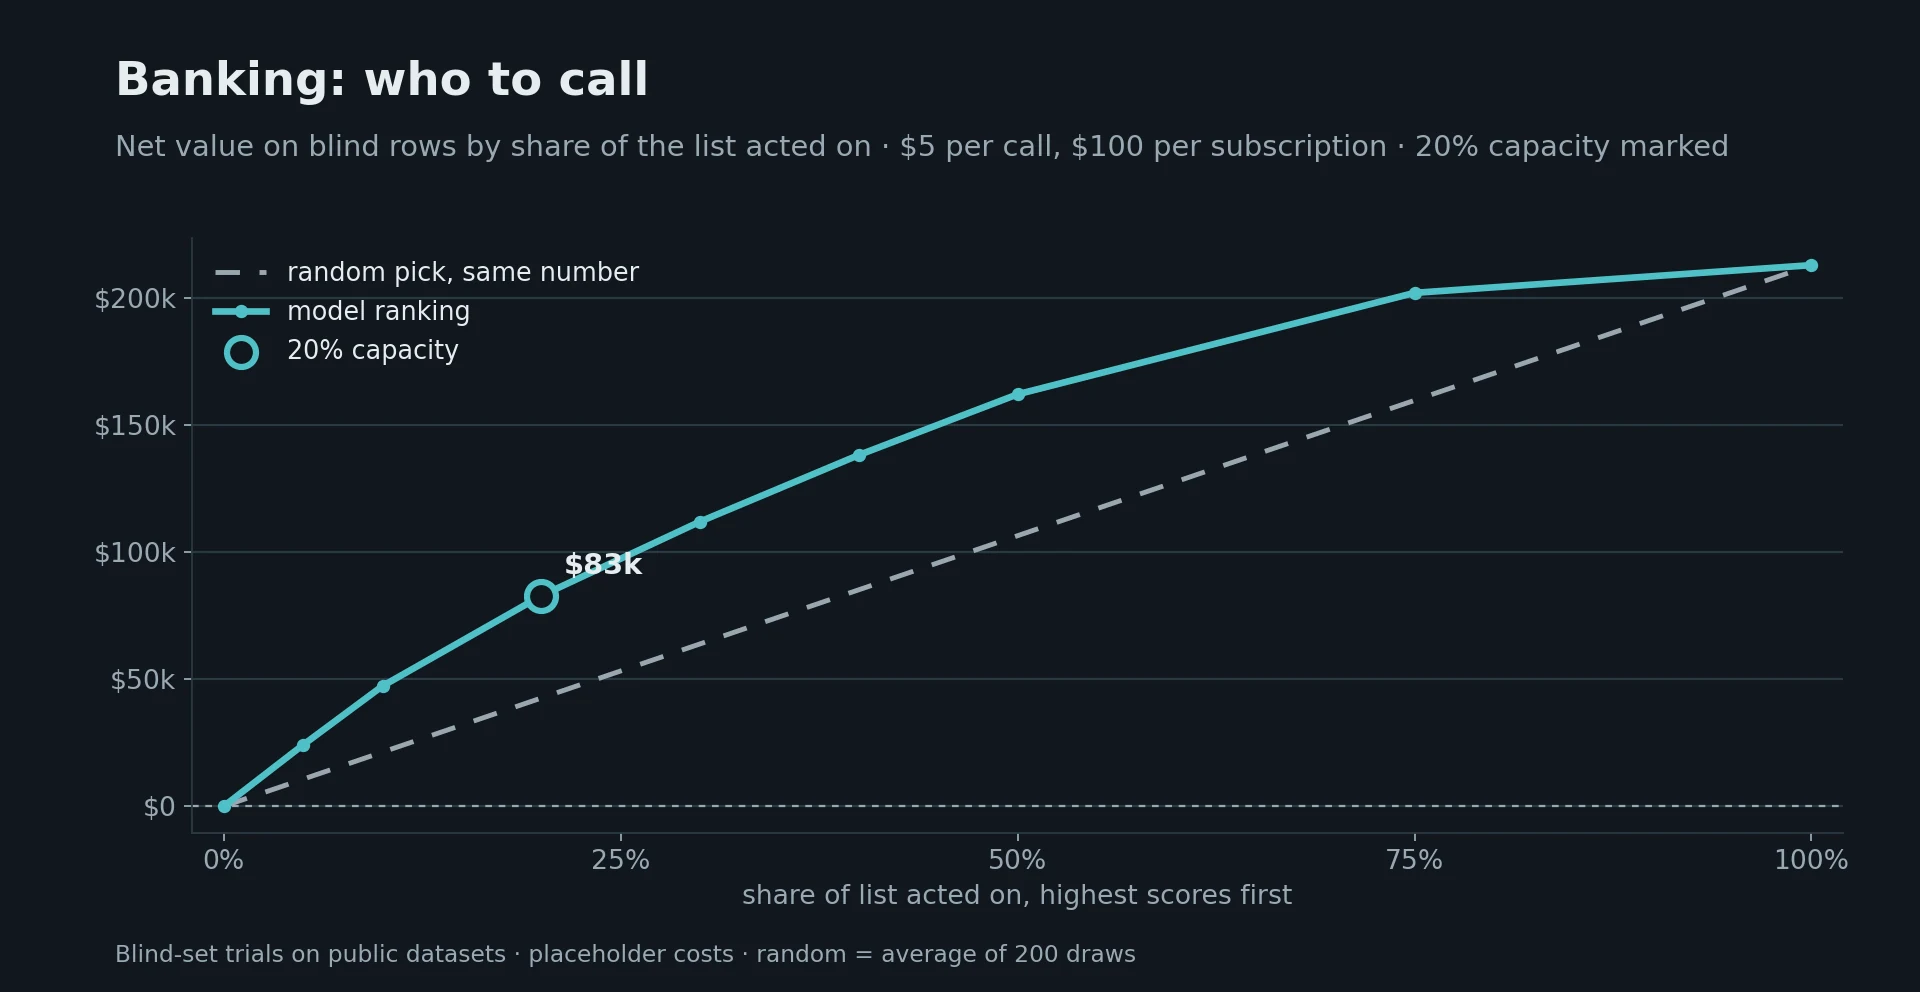
- Assumptions: $5 per call and $100 per subscription. At that cost, calling everyone pays best, because 31% of late-period calls converted against 11% in training. The ranking wins once calls cost $15 or more, or when capacity is limited.
- Conversion drift: because the conversion rate shifted this much, the model's predicted probabilities run low. Use the model to rank, not to forecast volume.
- The seat's leak check: it flagged
duration— known only after the call — as post-event and kept it out by default. That column is a classic reason published results on this dataset look better than they should; see target leakage.
Is a seat worth it? The agent's assessment
A dedicated private seat is listed at **5,988 a year) on yourcloudgroup.com, and is also available at $25 a day or $150 a week. An annual plan at $4,788 a year — about $399 a month, 20% below monthly — is being added. Prices as of 30 September 2026.
- Yes, for a business with at least one recurring decision that touches a few hundred cases a year or more and has a real cost per action.
- No, for occasional one-off analysis — a single month or week may be enough — or where acting on everyone is cheap and unlimited.
| Case | Extra value from the ranking | Per case scored | Cases a year to cover $5,988 (monthly) | … to cover $4,788 (annual) |
|---|---|---|---|---|
| Telco retention | $30.8k over offering everyone (1,408 customers) | about $22 per customer | about 274 customers | about 219 customers |
| Bank calls, 20% capacity | $40.2k over random calling (8,237 prospects) | about $4.90 per prospect | about 1,227 prospects | about 981 prospects |
| Bank calls, unlimited $5 calls | $0 — calling everyone pays best | $0 | never pays back | never pays back |
| Machines (synthetic) | $480k over no inspections (2,000 readings) | about $240 per reading | about 25 readings | about 20 readings |
Machine figures are an upper bound, not a forecast, because the data is synthetic.
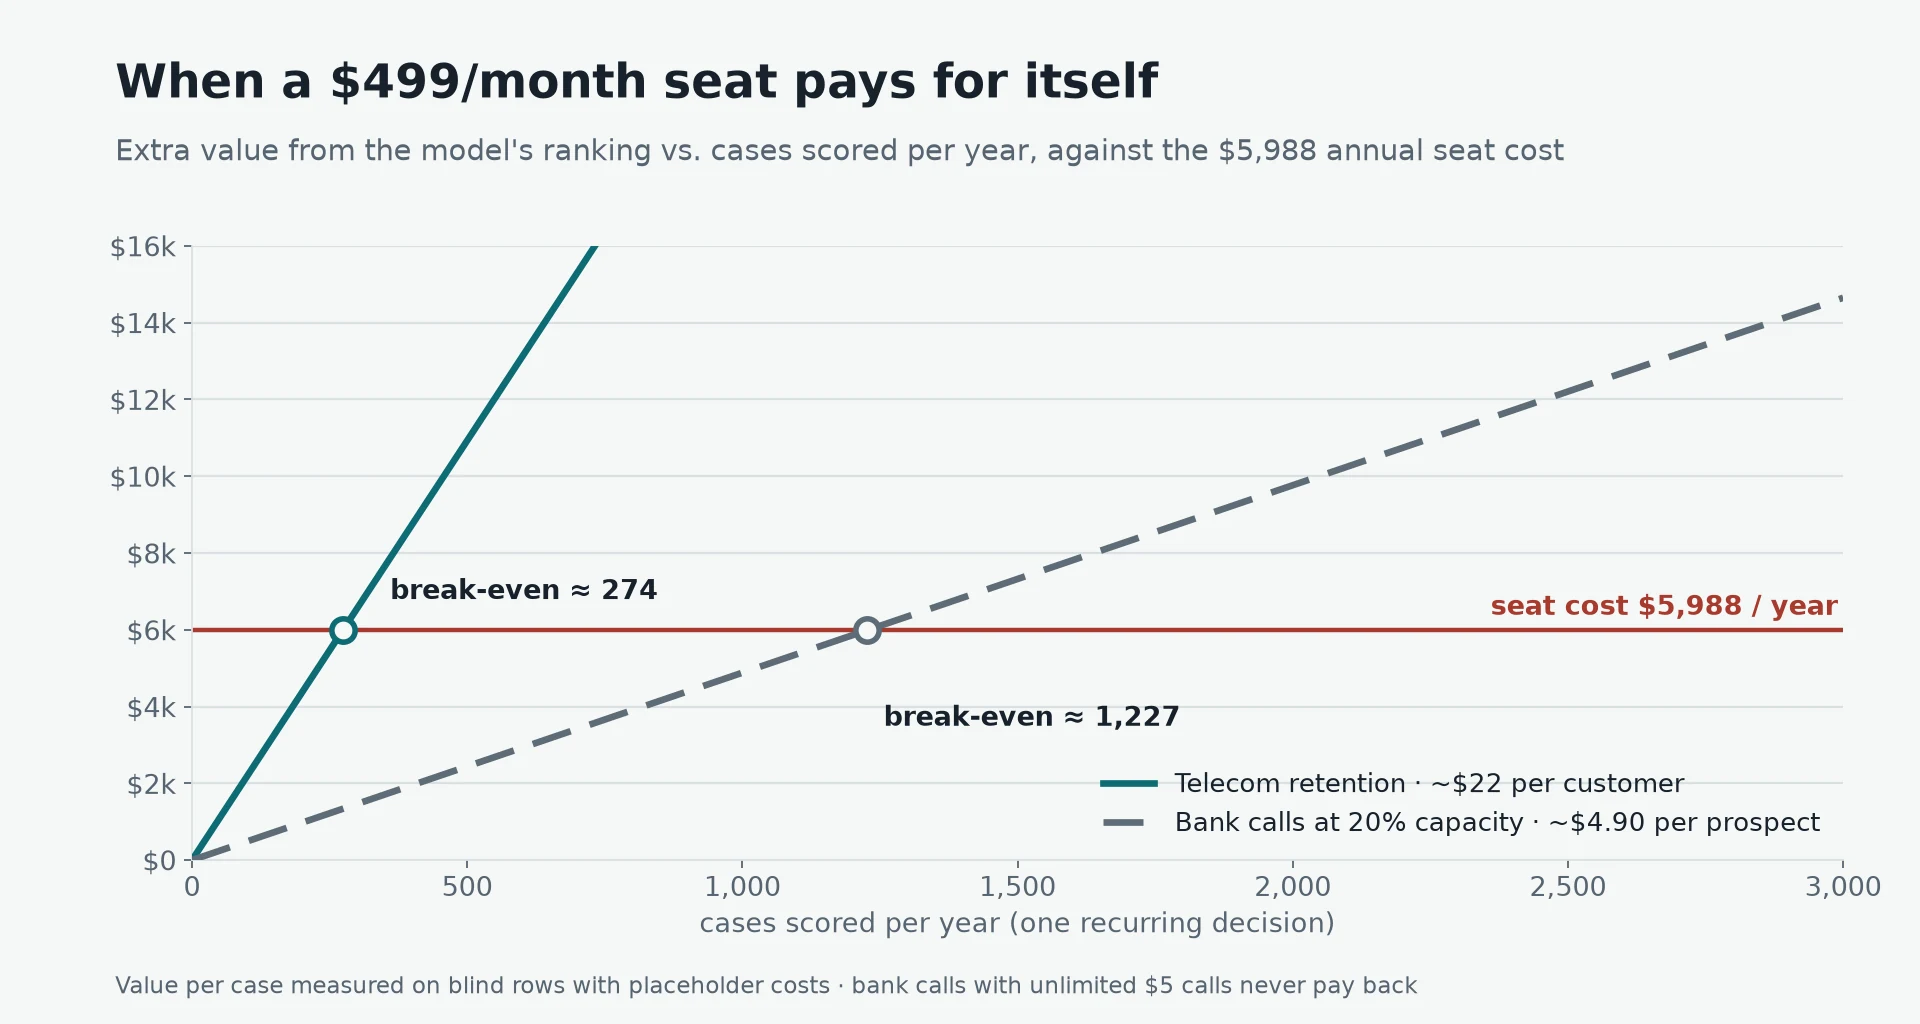
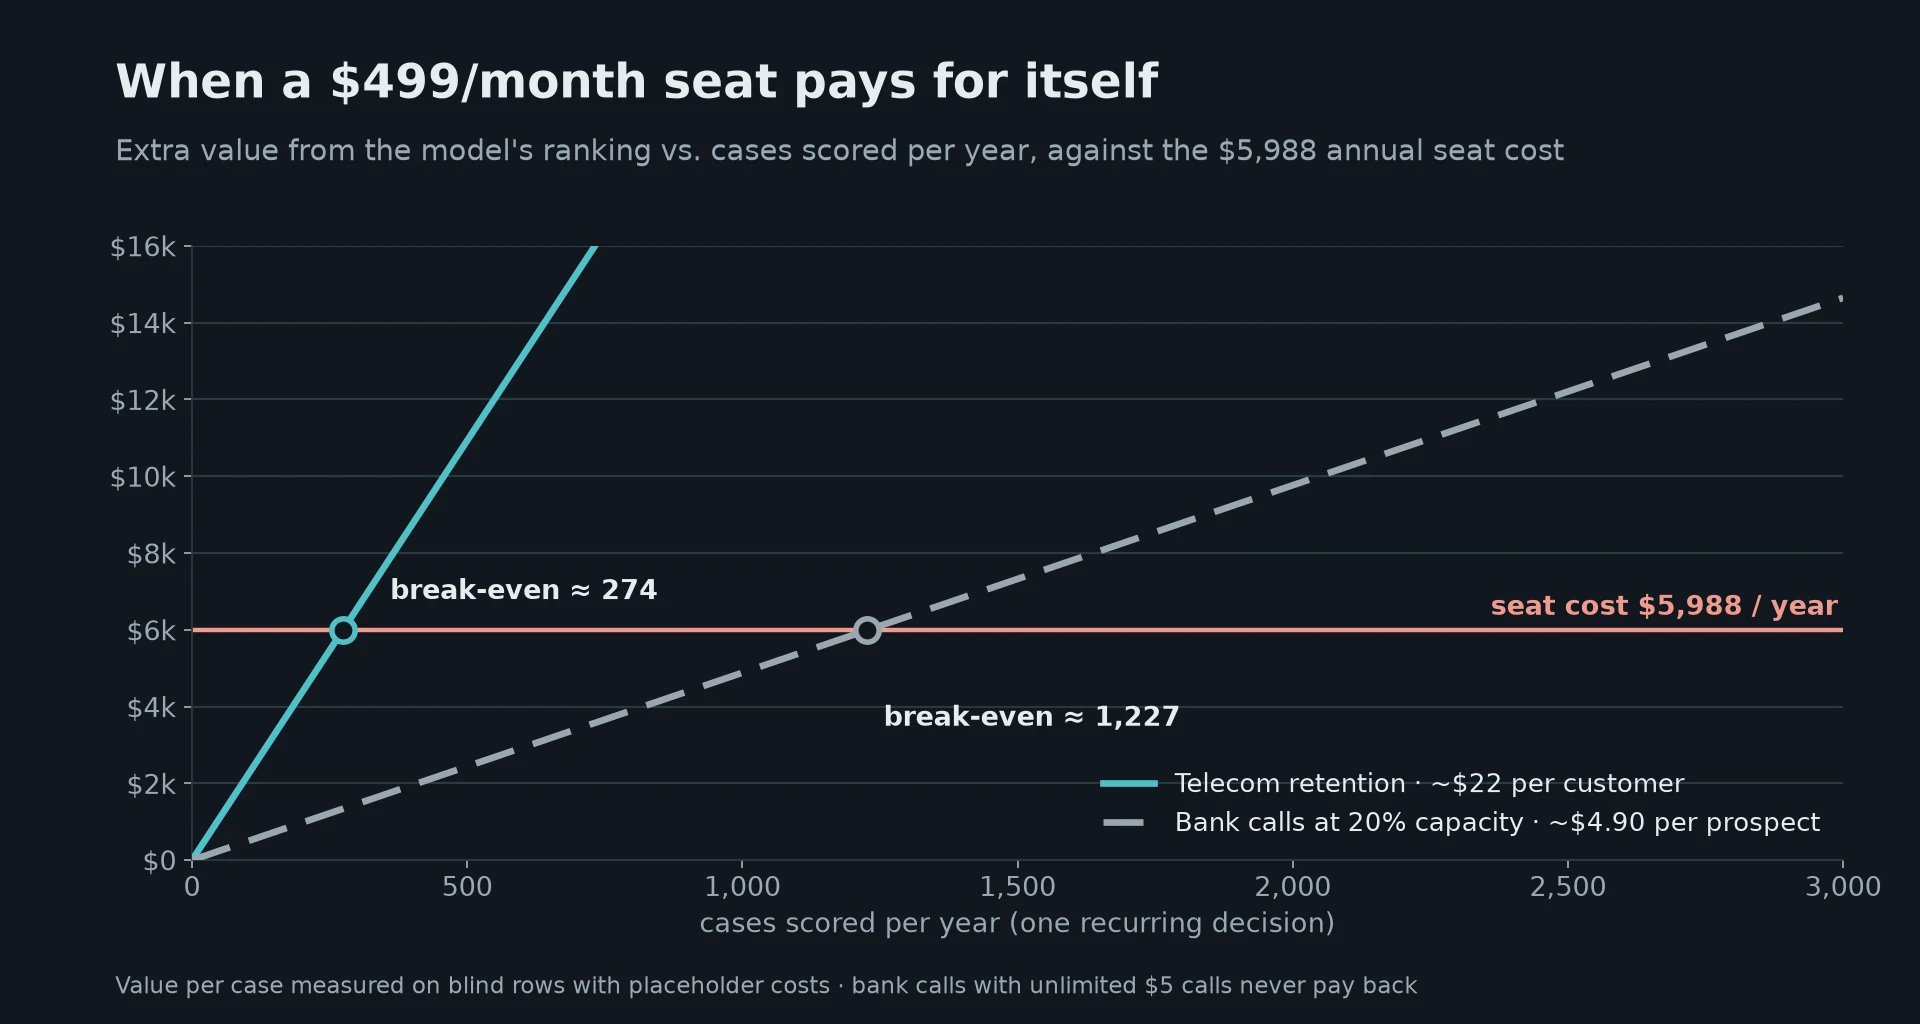
What the fee buys. The winning model types — random forest and XGBoost — are freely available, so the fee is not paying for them. It pays for the checks a small team would otherwise need a data scientist to provide: detection of leaks and ID columns; a fair twelve-variant contest on an untouched holdout; repeatable builds; a certificate that separates what is proven from what is not; and evaluation against outcomes that arrive later.
How to decide. Run one month on your own data, with your own costs, alongside current practice. Keep the seat if the ranked list clearly beats current practice by more than its cost, or is on course to beat $5,988 over a year — $4,788 on the annual plan, which makes sense once a recurring decision has proved itself. Otherwise, cancel.
Staff time for preparing data and reviewing flagged columns is not included. This assessment did not compare the price with other products.
When a spreadsheet is ready
Use the seat to rank cases for action, and judge it in dollars against current practice, when all four conditions hold:
| # | Condition | Why it matters |
|---|---|---|
| 1 | Each row is one case (a customer, a machine, a call, an order), and one column records what happened (e.g. churned yes/no). | The seat learns from past outcomes. Without them there is nothing to learn from. |
| 2 | At least a few thousand past cases, including a reasonable number of each outcome. | The smallest test here had 7,000 rows, and results were strong from there up. |
| 3 | Every column you keep would be known at the moment you want the prediction. | Information from after the event makes a model look brilliant in testing and fail in use. The seat catches the common cases, but a person who knows the data should confirm what it flags. |
| 4 | You can put a rough price on acting (a call, an offer, an inspection) and on a success. | The seat measures accuracy. Your costs turn that into a go/no-go decision. |
Also: add a date to each row if you can — with dates, the seat can certify every part of its verdict; without them, it certifies everything except outcome timing. Re-check against fresh outcomes every quarter — in the banking test, conversion jumped from 11% to 31% between the training and test periods. And start with one decision that has a clear cost, such as the next retention campaign.
Not a fit (yet): spreadsheets with no record of past outcomes; lists of a few hundred rows or fewer; numeric forecasts such as next month's sales (these trials tested yes/no outcomes only); and data with little real signal, which the seat reports honestly as weak — it cannot create signal that is not there.
Scorecard (criteria set before the runs)
| Criterion | Machines | Telco churn | Bank calls |
|---|---|---|---|
| Seat flags the leaking columns | Caught | n/a | Caught |
| Prediction-time availability certified | Certified (observation time) | Certified (observation time) | Needs reviewer² |
| Certified verdict at least MODERATE | Not assessed¹ · lift grade STRONG | Not assessed¹ · lift grade MODERATE | Not assessed¹ ² · lift grade WEAK |
| Top 20% at least 2.5× base rate | 4.9× | 2.4× (just short) | 1.8× |
| Beats treating everyone | 200k | $42k vs $11k | Only when calls cost ≥ $15 |
| Repeat run gives identical results | Identical | Identical | Identical |
| Standalone evaluation of the model | Measured | Measured | Measured |
| Full-data rebuild matches tournament | Identical | Identical | +1.9 pts (more data) |
¹ Outcome timing not established. To check that every outcome had time to appear, the seat needs a date for each prediction, and these datasets have none. It reports this as not established rather than guessing — see outcome observability. The lift grade is the seat's own threshold applied to the lower end of the 90% range of the measured lift. Lift is a relative improvement over the baseline, written as a fraction (0.47 = 47% better than the baseline): the lower bound is 0.47 for machines, 0.39 for telco and 0.08 for bank; MODERATE starts at 0.2 and STRONG at 0.4.
² Named event needs a reviewer. The bank data declares a named event, "before the call is placed", and a reviewer must confirm that every included column exists at that point.
For machines and telco, each prediction was declared to be made as its observation arrives, which the seat certifies without a timestamp. All three models were certified auditable and repeatable.
What the seat does well — and its current limits
Does well:
- Catches leaks on its own — the bank call duration, and the machine failure-mode labels as a group — and keeps ID and row-number columns out.
- Certifies undated data for prediction-time availability when each observation is scored as it arrives.
- Fair model selection: twelve variants per problem against a clean, untouched holdout, then the winner is rebuilt on all training rows.
- Repeatable: the same experiment gives identical models and numbers when run again. Four full-data rebuilds of a 60,000-row neural network gave byte-identical predictions.
- Later outcomes: it evaluates a live model against outcomes supplied weeks later. When the answers contain only one outcome, it reports accuracy as descriptive only and refuses the metrics that need both.
- No overstatement: it marks a claim "not established" when the data cannot support it.
Current limits:
- It cannot establish outcome timing without a date per prediction, so verdicts on undated data stay "not assessed".
- Columns whose timing depends on business meaning, such as the bank data's named event, need a reviewer's decision before prediction time can be certified.
- Models built before the seat recorded their outcome classes cannot be evaluated on their own; rebuild them to get measured metrics.
What these trials show — and what they do not
In one sentence: on blind rows from three public datasets, ranked predictions from a YourCloudGroup seat beat the obvious alternatives in two of three cases outright and in the third whenever calls cost $15 or more or capacity is limited.
They do not forecast results for any particular business. The dollar values use placeholder costs, the machine data is synthetic (so its figure is an upper bound), and the trials tested yes/no outcomes only. Staff time is excluded, and the price was not compared with other products.
How to get started
- Pick one decision with a clear cost and value, such as a retention offer, an inspection or a sales call.
- Export the history as a spreadsheet: one row per past case, the outcome in one column, and a date if you have one. See can you build an AI model from a CSV file?
- Upload and review. The seat proposes which columns to use and flags identifiers and possible leaks. A person who knows the data confirms the flagged columns.
- Run the tournament. The seat trains twelve model variants and scores the best one on held-back rows.
- Convert to dollars with your own costs, and choose how far down the ranked list to act.
- Pilot it alongside current practice for one cycle, then re-check against the new outcomes.
Method and sources
- Test design: each dataset was split into training rows and a blind 20% that no model saw. Bank data was split in time order: earlier calls for training, later calls for the test.
- Figures: all figures come from the blind rows. Profit curves compare acting on the model's top-ranked share with acting on a random pick of the same size, averaged over 200 draws.
- Data:
- Bank Marketing: Moro, Cortez & Rita (2014), UCI Machine Learning Repository, CC BY 4.0.
- AI4I 2020 Predictive Maintenance (synthetic): Matzka (2020), UCI Machine Learning Repository, CC BY 4.0.
- Telco Customer Churn: IBM sample data.
- Placeholder costs illustrate the method and are not forecasts for any particular business.
Build predictive models from your own data
YourCloudGroup Model Manager builds, evaluates, certifies and schedules predictive models from your CSV or spreadsheet data — point and click, on your own dedicated server.
Learn about Model Manager →Published by YourCloudGroup. Read our editorial standards and corrections policy.