Balanced Accuracy vs. Accuracy: Why the Difference Matters
Accuracy counts correct predictions; balanced accuracy averages how well each outcome is found. A measured example on 8,238 bank calls shows accuracy preferring the model that finds fewer customers.
In this article
Accuracy is the share of all predictions that are correct. Balanced accuracy is the average of the recall for each outcome — the share of real "yes" cases the model finds and the share of real "no" cases it finds — so a rare outcome counts as much as a common one. When one outcome is rare, the two numbers can disagree sharply, and accuracy tends to favour models that simply predict the common outcome.
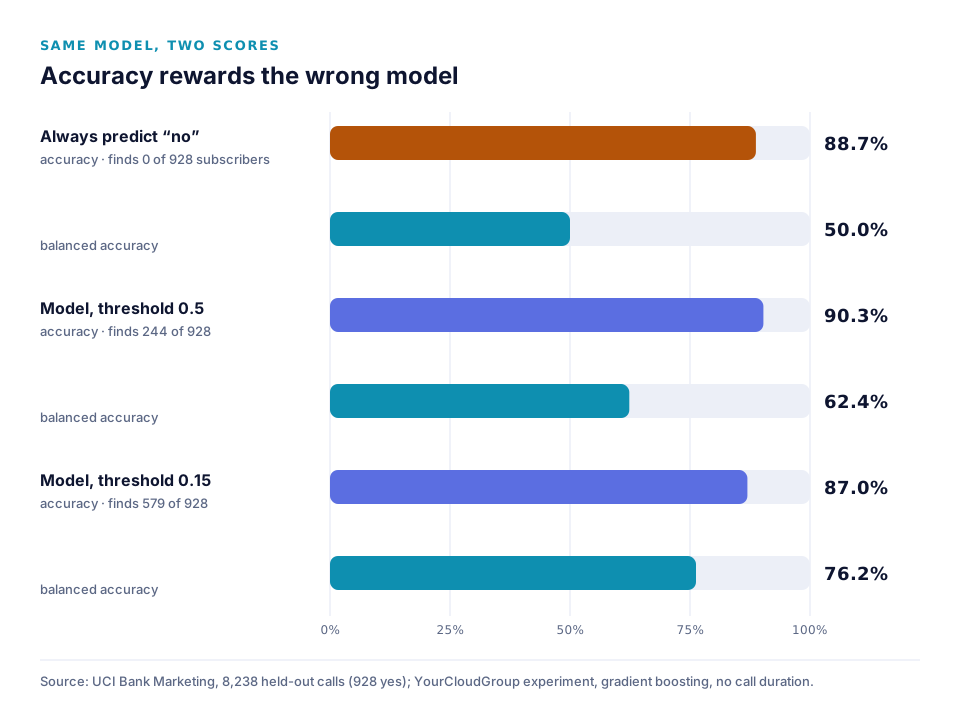
Measured example: on 8,238 held-out calls from a public bank-marketing dataset, of which 928 led to a subscription, a model scored 90.3% accuracy while finding only 244 of the 928 subscribers. Lowering its decision threshold made it find 579 — and its accuracy fell to 87.0%, while its balanced accuracy rose from 62.4% to 76.2%. A model that predicted "no" for every call would have scored 88.7% accuracy and found nobody.
How accuracy and balanced accuracy are calculated
For a yes/no prediction, every held-out row lands in one cell of a confusion matrix: true positives (TP), false negatives (FN), false positives (FP) and true negatives (TN).
- Accuracy = (TP + TN) ÷ all rows.
- Recall for "yes" = TP ÷ (TP + FN) — the share of real "yes" cases found.
- Recall for "no" = TN ÷ (TN + FP) — the share of real "no" cases found.
- Balanced accuracy = (recall for "yes" + recall for "no") ÷ 2. With more than two outcomes, it is the average recall across all of them.
Balanced accuracy is a standard classification metric (scikit-learn implements it as balanced_accuracy_score); it is not specific to any product. A model that always predicts the same outcome scores exactly 50% balanced accuracy on a two-outcome problem, however common that outcome is — which is why it is a useful sanity check.
A measured example: bank marketing calls
We used the public UCI Bank Marketing dataset: 41,188 calls a bank made to sell term deposits, with whether each customer subscribed. Subscriptions are the rare outcome — 11.3% of calls.
What we measured
- Split: 32,950 training calls and 8,238 held-out calls (928 subscribed, 7,310 did not), stratified with a fixed seed.
- Model: gradient boosting (scikit-learn 1.5.2). The call-duration column was removed because it is only known after the call — see what target leakage does to a model's score.
- What varied: only the decision threshold — the predicted probability above which a call is labelled "will subscribe". The model itself was trained once.
| Decision rule | Accuracy | Balanced accuracy | Subscribers found (of 928) | Non-subscribers wrongly flagged (of 7,310) |
|---|---|---|---|---|
| Always predict "no" | 88.7% | 50.0% | 0 | 0 |
| Model, threshold 0.7 | 89.5% | 54.8% | 93 | 29 |
| Model, threshold 0.5 (the usual default) | 90.3% | 62.4% | 244 | 115 |
| Model, threshold 0.3 | 89.1% | 72.9% | 483 | 457 |
| Model, threshold 0.15 | 87.0% | 76.2% | 579 | 725 |
| Model, threshold 0.1 | 82.4% | 76.0% | 630 | 1,155 |
| Model, threshold 0.05 | 48.7% | 65.4% | 808 | 4,109 |
What the result means
Judged by accuracy, the best rule is the default threshold of 0.5, and the do-nothing rule is barely worse. Judged by balanced accuracy, the best rule is a threshold around 0.15, which finds more than twice as many subscribers (579 against 244) at the cost of 610 more unnecessary calls. Accuracy hides that trade because the 7,310 non-subscribers outnumber the subscribers almost eight to one: every unnecessary call costs accuracy as much as every missed subscriber, and there are far more of the former to make.
Balanced accuracy is not always the right target either. At a threshold of 0.05 the model finds 808 subscribers but flags 4,109 non-subscribers; balanced accuracy drops, but if calls were nearly free and subscribers very valuable, that could still be the most profitable rule. The business spreadsheet trials show how putting real costs on each outcome settles the choice.
What the result does not show
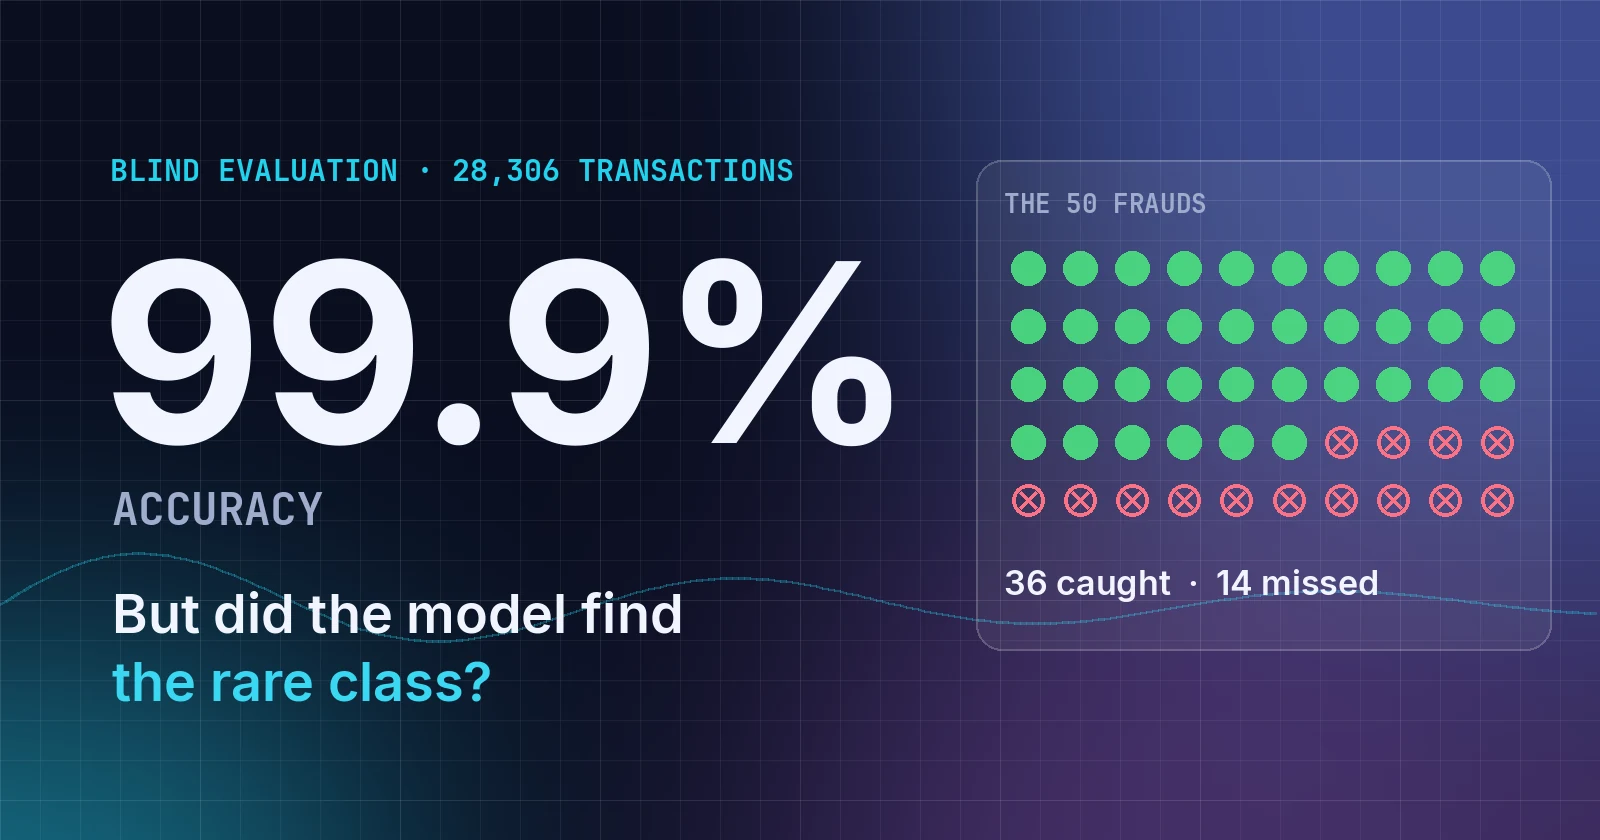
This is one dataset, one split and one model type. It shows how the two metrics behave when one outcome is about 11% of the data; the gap is larger for rarer outcomes — in the credit-card fraud evaluation, where fraud is 0.18% of transactions, accuracy was 99.93% and balanced accuracy 86.0%. The experiment is a YourCloudGroup analysis of public data, not a Model Manager run.
When to use which
- Use balanced accuracy to compare models on data where one outcome is rare, or when finding each outcome matters roughly equally. It cannot be inflated by predicting the common outcome.
- Use accuracy only when the outcomes are roughly balanced and every kind of mistake costs about the same.
- Look at recall for each outcome when one kind of mistake is worse than the other — a missed fraud is usually worse than a false alarm.
- Put money on it when you know what each outcome is worth; a profit or cost curve answers "which threshold?" directly.
- Always compare with the do-nothing baseline. If a model's accuracy is barely above "always predict the common outcome", the accuracy figure is telling you very little.
Macro F1 is a related metric that also gives each outcome equal weight but combines recall with precision; it is useful when false alarms matter as much as misses.
How YourCloudGroup Model Manager reports these metrics
YourCloudGroup Model Manager scores every classification model on a sealed blind set it never trained on, and reports confusion matrices and per-class results rather than a single accuracy figure. Its automatic model tournament chooses the winner on balanced accuracy and macro F1, not raw accuracy, for exactly the reason shown above. If the blind set is missing one of the outcomes, balanced accuracy and per-class recall read NOT MEASURABLE instead of being reported — see what it means to certify a machine-learning model.
Takeaway
Accuracy answers "how often is the model right?"; balanced accuracy answers "how well does it find each outcome?". When one outcome is rare, the second question is usually the one that matters. In the measured example, accuracy preferred the rule that found 244 of 928 subscribers over one that found 579.
Sources
- Moro, S., Cortez, P. and Rita, P. (2014). A data-driven approach to predict the success of bank telemarketing. Decision Support Systems 62, 22–31. Dataset: UCI Machine Learning Repository — Bank Marketing, licensed CC BY 4.0.
- scikit-learn,
balanced_accuracy_score. - YourCloudGroup experiment, 10 October 2026:
bank-additional-full.csv(md5f6cb2c1256ffe2836b36df321f46e92c), stratified 80/20 split with seed 42,HistGradientBoostingClassifier(random_state=42)with one-hot encoded categories,durationremoved, thresholds applied to predicted probabilities. - Code and expected output: balanced_accuracy_threshold_bank.py on GitHub — reproduce every number in this article.
Build predictive models from your own data
YourCloudGroup Model Manager builds, evaluates, certifies and schedules predictive models from your CSV or spreadsheet data — point and click, on your own dedicated server.
Learn about Model Manager →Published by YourCloudGroup. Read our editorial standards and corrections policy.