99.9% Accurate—and Why That Number Can Be Misleading
A real fraud-classification experiment scored 99.9% accuracy on 28,306 held-out transactions, yet missed 14 of 50 frauds. Here is why accuracy alone misleads on imbalanced data.
In this article
Accuracy can be misleading because, on imbalanced data, a model can be almost always right while still missing most of the cases you actually care about. When one outcome is rare — fraud, churn, equipment failure — accuracy is dominated by the common outcome and says very little about the rare one.
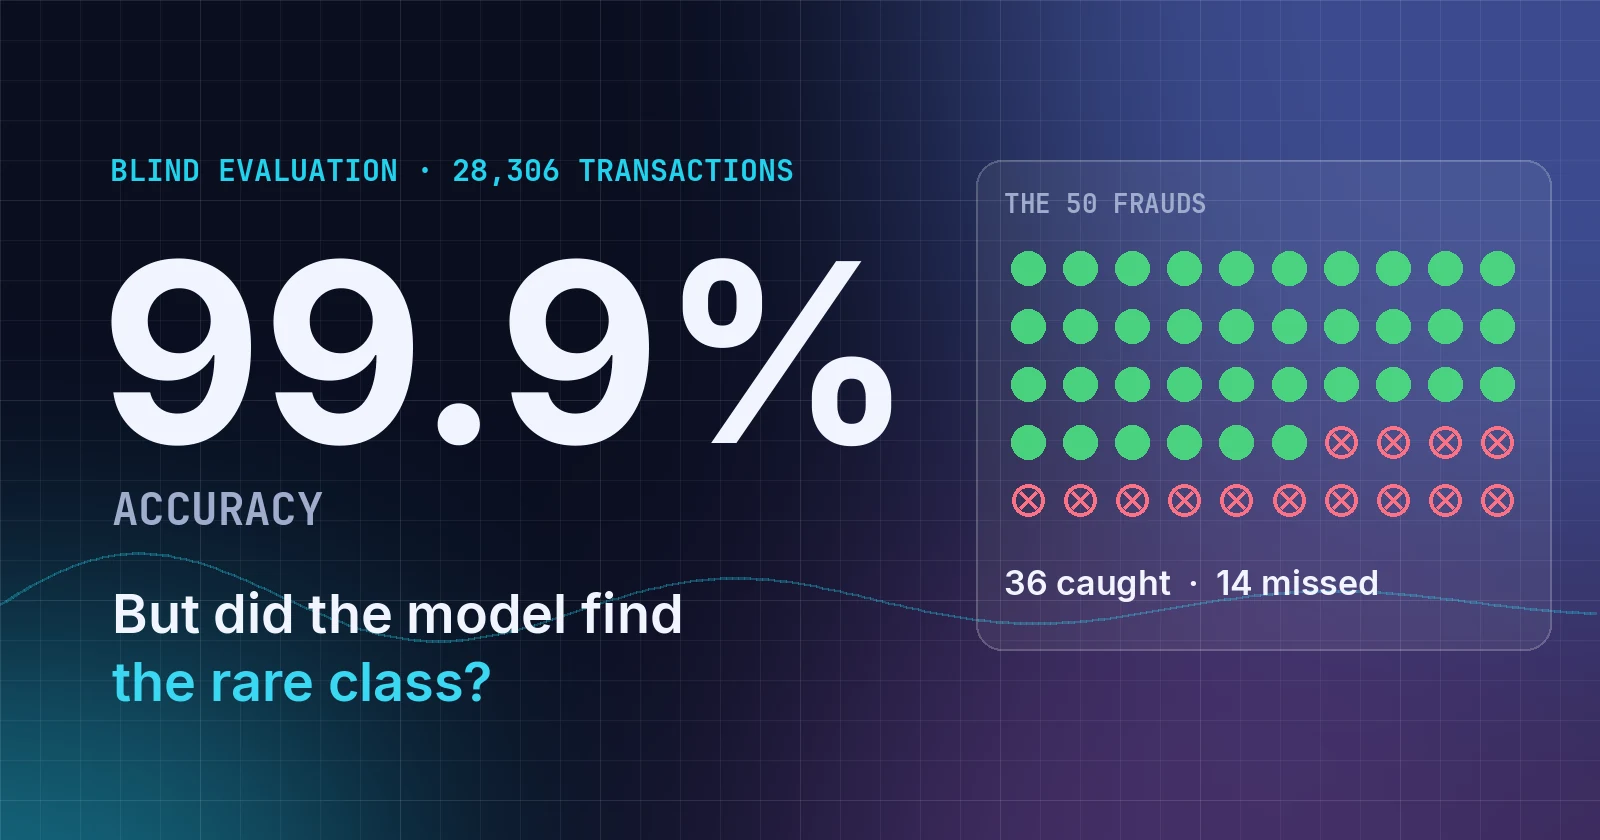
We tested a credit-card fraud model built with YourCloudGroup Model Manager against 28,306 transactions it had never seen. It classified 28,285 of them correctly: 99.9% accuracy. That sounds extraordinary. But a "model" that simply labelled every transaction as legitimate would have scored 99.8% on the same data — while catching zero fraud.
The number that matters here is different: the model found 36 of the 50 fraudulent transactions (72% recall) and raised only 7 false alarms. That is a genuinely useful result, but it is a very different story from "99.9% accurate."
The data: a public credit-card fraud dataset
The source data is the public Credit Card Fraud Detection dataset released by the Machine Learning Group of the Université Libre de Bruxelles (ULB) and hosted on Kaggle. It contains 284,807 anonymised card transactions made by European cardholders over two days in September 2013, of which 492 — about 0.17% — are fraudulent. The features are anonymised principal components (V1–V28) plus the transaction time and amount.
YourCloudGroup did not create this data. What follows is our experiment on it, and then our interpretation of the result.
What we did: a blind evaluation
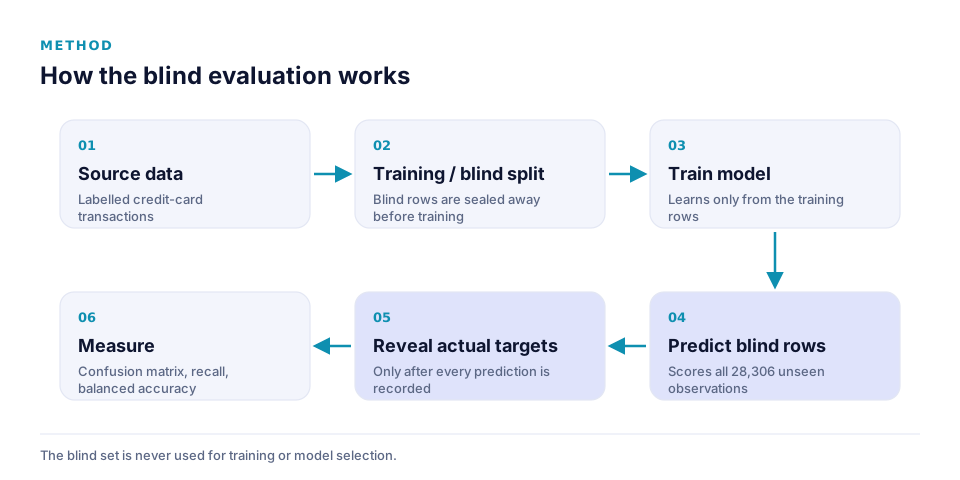
We built a fraud classifier in YourCloudGroup Model Manager and then evaluated it on a set of observations that were held out from training and never seen by the model. This is a held-out evaluation: the model makes its predictions first, and only then are the actual outcomes revealed and compared.
If you want the full reasoning behind this discipline, see what held-out model evaluation is and why it matters.
What we measured
The blind evaluation set contained 28,306 transactions: 28,256 legitimate (Class 0) and 50 fraudulent (Class 1). Fraud made up about 0.18% of the set, close to the source dataset's overall rate.
The results, as a confusion matrix:
| Result | Count |
|---|---|
| True negatives (legitimate, predicted legitimate) | 28,249 |
| False positives (legitimate, flagged as fraud) | 7 |
| False negatives (fraud, missed) | 14 |
| True positives (fraud, caught) | 36 |
| Total observations | 28,306 |
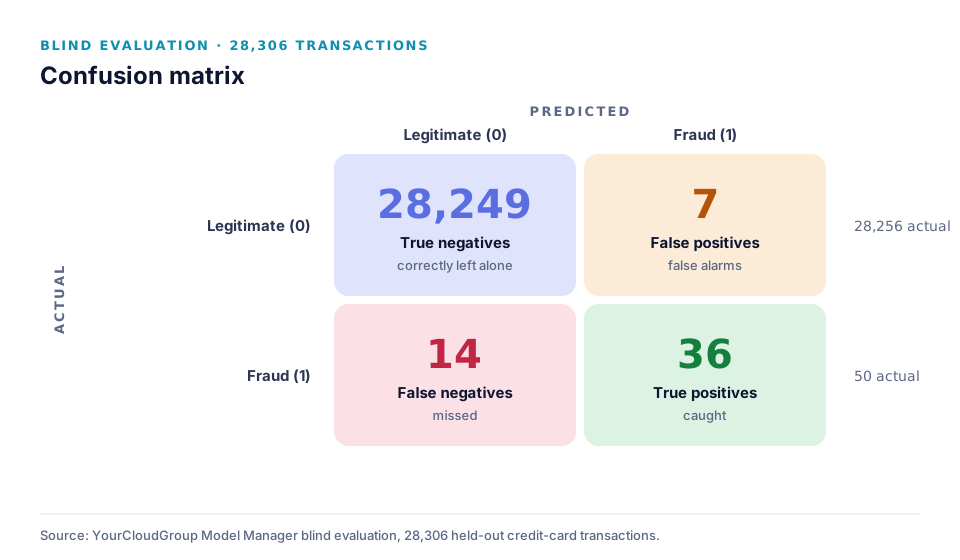
From those four counts, every metric below follows directly:
| Metric | Value | How it is calculated |
|---|---|---|
| Accuracy | 99.93% | 28,285 correct ÷ 28,306 |
| Accuracy of "always predict legitimate" | 99.82% | 28,256 ÷ 28,306 |
| Recall, legitimate class | 99.98% | 28,249 ÷ 28,256 |
| Recall, fraud class | 72.0% | 36 ÷ 50 |
| Precision, fraud class | 83.7% | 36 ÷ 43 flagged |
| Balanced accuracy | 86.0% | average of the two recalls |
| F1 score, fraud class | 0.774 | harmonic mean of fraud precision and recall |
| Macro F1 | 0.887 | average F1 across both classes |
Why accuracy misleads on imbalanced data
Accuracy treats every observation equally. When 99.8% of observations belong to one class, 99.8% of the accuracy score is decided by that class. The rare class — the one the model exists to find — can barely move the number.
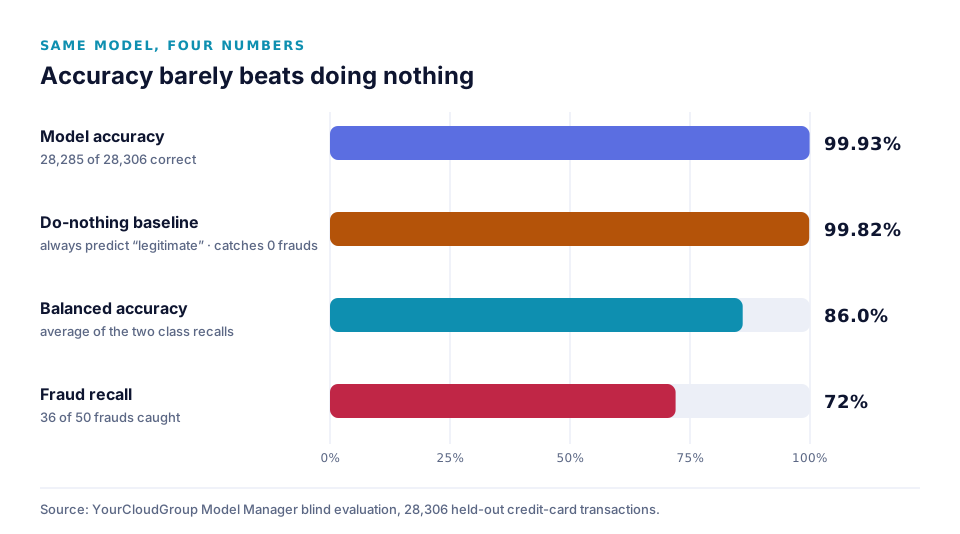
That is why the do-nothing baseline matters so much. Flagging nothing at all scores 99.82%. Our model scores 99.93%. The entire difference between a useless model and a useful one is squeezed into the last tenth of a percentage point.
Recall by class tells the real story:
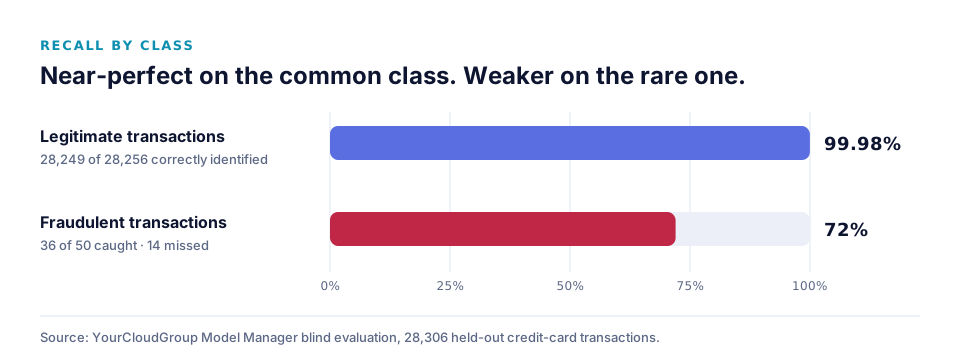
This pattern is called class imbalance, and it is the norm, not the exception, in business problems. Most customers do not churn. Most machines do not fail this week. Most invoices are paid. Any time the outcome you care about is rare, accuracy alone will flatter the model.
What the result means
In a held-out evaluation of 28,306 credit-card transactions, the model correctly classified 28,285 observations. It identified 36 of the 50 fraudulent transactions, with 7 false positives and 14 false negatives.
Interpreted plainly:
- The model is useful. Catching 72% of fraud while flagging only 7 legitimate transactions out of 28,256 is a meaningful result. Of the 43 transactions the model flagged, 36 — about 84% — really were fraud, so a reviewer's time would mostly be well spent.
- The model is not complete. 14 of 50 frauds (28%) went undetected. Whether that is acceptable depends on the cost of a missed fraud versus the cost of a false alarm — a business decision, not a statistical one.
- The headline number is the least informative one. 99.9% accuracy is true, but on its own it does not distinguish this model from one that does nothing.
What this result proves
- On this specific blind evaluation set, the model separated fraudulent from legitimate transactions far better than chance or a do-nothing baseline.
- The model's predictions were made before the actual outcomes were revealed, so the result is not inflated by the model having seen the answers.
- Measured on the rare class, the model achieved 72% recall and 83.7% precision.
What this result does not prove
This experiment measures performance on the stated held-out population. It does not establish that future transaction populations will have the same distribution, and it does not guarantee future production performance. Fraud patterns change over time, and the source data covers only two days in 2013.
It also does not show that this is the best achievable model for this data, that the same settings would perform equally well on a different card portfolio, or that 72% recall is good enough for any particular business. With only 50 fraud cases in the evaluation set, each missed fraud moves fraud recall by two percentage points, so the rare-class metrics carry real statistical uncertainty.
How YourCloudGroup Model Manager handles this
YourCloudGroup Model Manager reports more than a single accuracy figure. Its evaluation suite includes confusion matrices, per-class accuracy, confidence analysis and row-by-row results, and every model in its automatic tournament is scored against the same sealed blind set. The tournament winner is chosen on balanced accuracy and macro F1, not on raw accuracy — precisely because raw accuracy rewards a model for predicting the majority class, as this experiment shows. That makes it possible to see — as here — that a 99.9% headline hides a 72% result on the class that matters.
If a blind set were missing one of the classes a model was built to predict, Model Manager would not report balanced accuracy, macro F1 or per-class recall for it at all: those metrics read NOT MEASURABLE, with the raw figure shown beside them, and accuracy stays visible only as a descriptive number.
The platform does not decide for you whether 72% recall is acceptable. It shows you the numbers you need to make that decision.
Takeaway
When the outcome you care about is rare, ignore the accuracy headline until you have seen three things: the do-nothing baseline, the recall on the rare class, and the confusion matrix. If a model's accuracy is only slightly above the baseline, the real question is how many of the rare cases it actually found. In this experiment the answer was 36 of 50 — a useful model, honestly described.
For the broader context on when a structured-data model like this is the right tool, see predictive AI vs. generative AI.
Build predictive models from your own data
YourCloudGroup Model Manager builds, evaluates, certifies and schedules predictive models from your CSV or spreadsheet data — point and click, on your own dedicated server.
Learn about Model Manager →Published by YourCloudGroup. Read our editorial standards and corrections policy.